When Is the First Snow in 2026? Dates for 296 U.S. Cities
The first snow usually comes in October to the northern Rockies, in November to the Great Lakes and in December to the big Eastern cities. Dates for 296 cities, and what the 2026 forecast says.
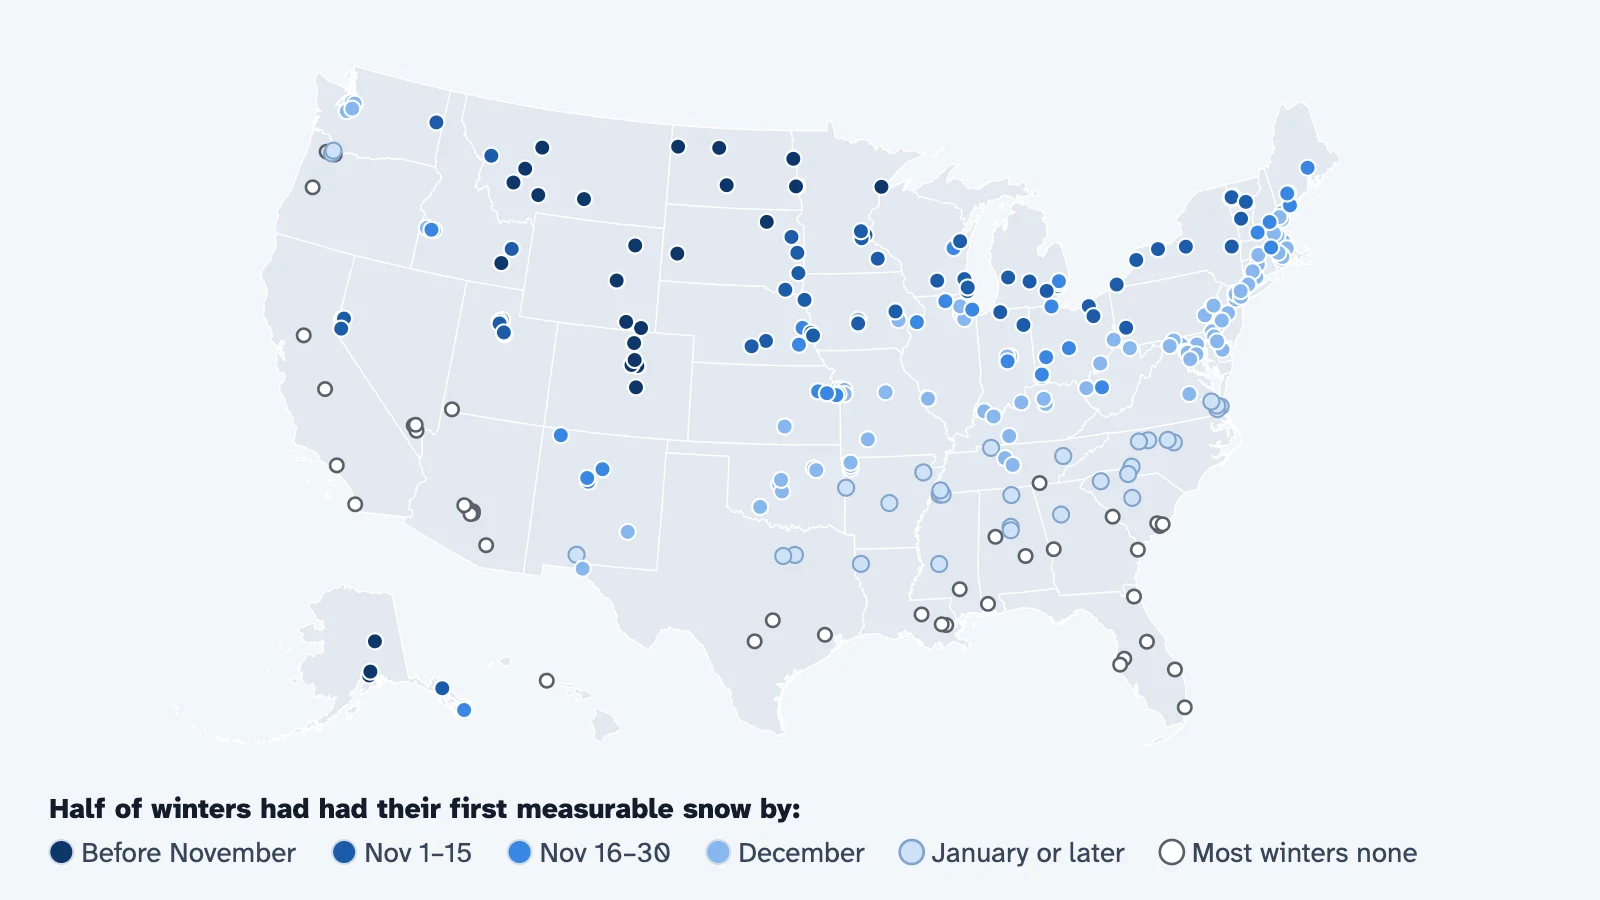
The first measurable snow of the winter, 0.1 inch or more in a day, usually reaches the northern Rockies and Plains in October, the upper Midwest and the Great Lakes in November and the big cities of the East in December. In our count of NOAA’s daily station records through ACIS, half of the winters from 1991–92 to 2020–21 had brought it by October 12 in Denver, November 7 in Minneapolis and Buffalo, November 16 in Chicago, December 1 in Boston, December 9 in New York and December 19 in Washington, D.C.
This year’s first snowfall forecast starts from a late fall. Of the 28 cities on our map where the first snow usually comes by the end of October, only 8 had reported it by October 30 (ACIS). Denver, whose average date is October 19, was still waiting (NWS Boulder).
In its updated outlook of October 31, NOAA’s Climate Prediction Center still favors a warmer than normal November across the northern U.S., most strongly in the Northern Plains and the Upper Mississippi Valley (CPC). Its forecasters also flag a possible disruption of the polar vortex next week, which would be very rare in November and could bring cooler spells (CPC). Odds like these tilt a week or a month; they do not rule out a cold day.
Where is snow in the forecast right now?
The closest thing to a first snowfall forecast is the National Weather Service’s own, a few days out. The list adds up the snow in its hour-by-hour forecast for each of our 296 cities over the next three days, the same forecast our calculator reads, and is worked out again every half hour. A city appears once its forecast holds 0.1 inch or more.
From the National Weather Service forecast, checked 6:07 AM EST, Thursday. The list adds up its next three days.
None of the 296 cities with a forecast in this run has snow in the next three days.
How far ahead can snow be forecast? NOAA says snow forecasts “are generally not predictable more than a week in advance” (NOAA). What exists weeks ahead are outlooks: the odds of a warmer or colder, wetter or drier stretch than normal. They come further down this page.
When does the first snow usually fall?
The first measurable snowfall is the first day of the winter with 0.1 inch of snow or more at a weather station, as the Weather Service counts it (NWS Buffalo). Flakes that melt, or fall too lightly to measure, are only a trace and do not count. Buffalo shows the gap: its first flake comes on October 24 on average, its first measurable snow on November 8 and its first inch on November 18 (NWS Buffalo).
The map below stands a column on each city. Its height is how often, in the 30 winters from 1991–92 to 2020–21, the first measurable snow had come by the date you pick. Move the slider through the dates from October 1 to January 31 and watch the first snow spread south.
Winters with measurable snow by November 30
- None
- 1 to 24%
- 25 to 49%
- 50 to 74%
- 75% or more
- Records too incomplete to say
By November 30, at least half of winters had brought measurable snow to 115 of the 281 cities with complete enough records.
In our count of those records (ACIS), at least half of the winters had brought measurable snow by October 31 to 28 cities, nearly all in Alaska, Montana, Wyoming, Colorado and the Dakotas. By November 15 the count reaches 80, with Minneapolis, Salt Lake City, Buffalo and Milwaukee; by Thanksgiving it is 105, and by Christmas, 201.
December is the big month. In 94 of the cities the first snow usually comes then, among them Boston, St. Louis, Kansas City, New York, Baltimore, Philadelphia, Washington and Nashville. Another 31 usually wait until January or later, including Memphis, Raleigh, Charlotte, Atlanta and Dallas. In 41, from Phoenix and Los Angeles to Houston, New Orleans and every Florida city on our map, most winters bring no measurable snow at all.
Height counts as well as latitude. Denver, a mile up, usually has its first snow by October 12 in our count, nearly four weeks before Minneapolis, far to its north. Our dates sit close to the Weather Service’s own: Chicago’s normal first measurable snow is November 18 (NWS Chicago), two days after ours, and the Twin Cities’ average is November 4 (NWS Twin Cities), three days before ours. Denver’s page, whose records go back to 1882, gives October 19 as the average (NWS Boulder), a week later than the 1991–2020 date at the station we read there.
When will it first snow where you live?
Pick your state and city: the card shows when its first snow usually comes, how the odds build up to Christmas, this winter so far and the next three days of the National Weather Service forecast.
When does it first snow here?
Chicago, Illinois
Usually by November 16
- By November 1539% 11 of 28 winters
- By Thanksgiving, November 2668% 19 of 28 winters
- By November 3068% 19 of 28 winters
- By Christmas100% 28 of 28 winters
- By January 31100% 28 of 28 winters
- Middle half of winters
- Nov 9 to Dec 4
- Earliest
- October 12, 2006
- First inch
- Usually by December 4
- This winter
- None yet, in reports through October 30.
- Next 3 days
- No snow in the forecast. National Weather Service forecast, checked 6:07 AM EST, Thursday.
- Record
- Chicago Area (ORDthr), the city’s long-running record; main station 14.2 miles away.
From NOAA's daily station records through ACIS, winters of 1991–92 to 2020–21; "usually by" is the date by which half of them had had their first measurable snow (0.1 inch or more in a day). Past winters are no promise for this one.
Think of the card as a first snowfall forecast from history, and read its dates as odds, not a schedule. In Chicago, the first measurable snow had come by Thanksgiving in 68% of the winters counted, so in about 1 in 3 it came later (ACIS). For most big cities the record is the long one the Weather Service keeps for the city, often at its main airport.
One usual date hides how much the first snow wanders from winter to winter. In the strips below, each dot is one winter’s first snow. Pick up to three cities to set them side by side.
Thirty winters, thirty dots
Denver, Colorado Half of winters by October 12. Snow in 30 of 30 winters. The earliest first snow came on September 9, 2020; the latest on November 18, 2016.
Chicago, Illinois Half of winters by November 16. Snow in 28 of 28 winters. The earliest first snow came on October 12, 2006; the latest on December 20, 2012.
Atlanta, Georgia Half of winters by February 1. Snow in 20 of 30 winters. The earliest first snow came on November 27, 2013.
What does NOAA’s November 2026 outlook say?
It still leans toward a warm November up north. The Climate Prediction Center’s updated outlook, issued October 31, keeps enhanced odds of above-normal temperatures across the northern U.S. and along both coasts, raises them to 50 to 60% across the northern tier and spreads them further south, over more of the Southeast. The best odds, 60 to 70%, are over the Northern Plains and the Upper Mississippi Valley (CPC’s updated November discussion). Its first outlook, issued October 15, pointed the same way (CPC’s November discussion).
For precipitation, the update made bigger changes. It raised the odds of a wetter than normal November to 60% in the Southwest and to 50% across the north-central states, where a little rain or snow early in the month goes a long way in a dry month, and lowered them for the Southeast and East Coast, where early November looks dry (CPC). The discussion still names El Niño as the main influence (CPC).
The update also carries a warning. Computer models show a possible disruption of the stratospheric polar vortex next week, and perhaps a sudden stratospheric warming. NOAA’s forecasters call one in November “very rare,” and write that its effects can last up to 2 months, usually as a negative Arctic Oscillation, which could mean cooler periods; it adds uncertainty most of all in the eastern U.S. (CPC).
The shorter outlooks, issued October 31, point the same way for now. For November 6 to 10, above-normal temperatures are favored across all 50 states, with odds rising from about 40% in the south-central states to more than 80% in the northernmost Great Plains. For November 8 to 14, warmth is favored across most of the lower 48 except parts of the Southeast, where near or below normal temperatures are favored, with a drier than normal week from the northern Great Plains through the Mississippi and Ohio Valleys to the Great Lakes. The Center rated its confidence in both as about average, 3 out of 5 (CPC 6–10 and 8–14 day outlooks).
What does that mean for a first snowfall forecast? By our reading, warmer and drier than normal leans against an early first snow in the north, and the polar vortex is a wild card for later in the month. But these are odds for a week’s or a month’s average temperature and total precipitation, and they are not snow forecasts: NOAA’s seasonal outlook does not project snowfall (NOAA). A cold few days inside a warm month can still bring the first snow.
Does a strong El Niño mean a late first snow?
Not by itself, going by the record. The Climate Prediction Center has an El Niño Advisory in force, and on October 8 it called a strong to very strong El Niño likely through January to March 2027 (ENSO discussion). Its October odds give a very strong event, with its index at 2.0°C or more, an 81% chance for December to February (ENSO strength odds). NOAA’s winter outlook expects it to shift the jet stream south and east, with a warmer northern U.S. and a wetter South (NOAA).
So we looked at the winters it has happened before. From 1991–92 to 2020–21, the Center’s index reached 2.0°C or more in three: 1991–92, 1997–98 and 2015–16 (CPC’s El Niño table). In the 134 cities on our map whose records cover all 30 winters and that had measurable snow in at least half of them, the first snow came early in most of them in 1991–92 and 1997–98, and late in most of them in 2015–16 (ACIS).
The first snow in the very strong El Niño winters, 134 cities
1991–92 The middle city: 5.5 days early
91 earlier10 on the usual date33 later, of 134 cities
1997–98 The middle city: 12 days early
84 earlier15 on the usual date35 later, of 134 cities
2015–16 The middle city: 19.5 days late
20 earlier8 on the usual date106 later, of 134 cities
Three winters cannot make a rule, and these point in opposite directions. The Center itself says an El Niño’s strength “does not necessarily correspond with the strength of the influence” (ENSO strength odds). A strong El Niño tilts a season’s averages. The first snow comes down to one cold day with enough moisture.
Has it already snowed this season?
Only in a few places. The tiles are the 28 cities on our map where the first snow usually comes by October 31, earliest first, and where each stood in NOAA’s daily reports, which are preliminary (ACIS). The most so far fell at Great Falls, Montana: 6.4 inches on October 10.
Where the first snow usually comes by October 31
By October 30: 8 had measurable snow18 none yet2 no recent reports
- Fairbanks, AK, usually by September 30; this winter: measurable snow on October 1
- Laramie, WY, usually by October 2; this winter: none yet
- Butte, MT, usually by October 4; this winter: measurable snow on October 10
- Casper, WY, usually by October 4; this winter: none yet
- Great Falls, MT, usually by October 4; this winter: measurable snow on October 10
- Cheyenne, WY, usually by October 6; this winter: none yet
- Bozeman, MT, usually by October 8; this winter: measurable snow on October 11
- Gillette, WY, usually by October 10; this winter: none yet
- Denver, CO, usually by October 12; this winter: none yet
- Billings, MT, usually by October 13; this winter: none yet
- Rapid City, SD, usually by October 16; this winter: none yet
- Anchorage, AK, usually by October 17; this winter: measurable snow on October 1
- Williston, ND, usually by October 20; this winter: no recent reports
- Minot, ND, usually by October 23; this winter: no recent reports
- Colorado Springs, CO, usually by October 24; this winter: none yet
- Duluth, MN, usually by October 24; this winter: none yet
- Fort Collins, CO, usually by October 24; this winter: none yet
- Grand Forks, ND, usually by October 26; this winter: none yet
- Helena, MT, usually by October 26; this winter: measurable snow on October 10
- Wasilla, AK, usually by October 26; this winter: measurable snow on September 30
- Bismarck, ND, usually by October 28; this winter: none yet
- Thornton, CO, usually by October 28; this winter: none yet
- Aberdeen, SD, usually by October 29; this winter: none yet
- Aurora, CO, usually by October 29; this winter: none yet
- Fargo, ND, usually by October 29; this winter: none yet
- Lakewood, CO, usually by October 29; this winter: none yet
- West Fargo, ND, usually by October 29; this winter: none yet
- Pocatello, ID, usually by October 31; this winter: measurable snow on October 12
No other city on our map had reported measurable snow.
Denver has waited this long before: its latest first snow on record came on December 10, 2021, and the second latest last winter, on November 29, 2025 (NWS Boulder).
When do the big cities usually see their first snow?
The calendar sets twelve big cities on one strip, from Denver to Atlanta. The mark is the date by which half of the winters had brought measurable snow. The bar covers the middle half of winters, so a long bar means a city whose first snow comes at very different times from year to year.
When the first measurable snow comes, 1991–92 to 2020–21 winters
- Denver, COHalf of winters by Oct 12 ; the middle half of winters: Oct 4 to Nov 1
- Anchorage, AKHalf of winters by Oct 17 ; the middle half of winters: Oct 11 to Oct 28
- Minneapolis, MNHalf of winters by Nov 7 ; the middle half of winters: Oct 27 to Nov 15
- Chicago, ILHalf of winters by Nov 16 ; the middle half of winters: Nov 9 to Dec 4
- Detroit, MIHalf of winters by Nov 19 ; the middle half of winters: Nov 9 to Nov 30
- Boston, MAHalf of winters by Dec 1 ; the middle half of winters: Nov 14 to Dec 8
- Kansas City, MOHalf of winters by Dec 3 ; the middle half of winters: Nov 11 to Dec 20
- New York, NYHalf of winters by Dec 9 ; the middle half of winters: Dec 2 to Dec 19
- Philadelphia, PAHalf of winters by Dec 16 ; the middle half of winters: Dec 5 to Jan 9
- Washington, DCHalf of winters by Dec 19 ; the middle half of winters: Dec 5 to Jan 16
- Nashville, TNHalf of winters by Dec 29 ; the middle half of winters: Dec 5 to Jan 20
- Atlanta, GAHalf of winters by Feb 1 ; the middle half of winters: Jan 2 or later, or none
The first city and the last are nearly four months apart: Denver’s usual date, October 12, comes 16 weeks before Atlanta’s, February 1, and in 10 of the 30 winters Atlanta had no measurable snow at all (ACIS). The South also wanders most. Nashville’s middle half runs from December 5 to January 20 and Washington’s from December 5 to January 16, while Minneapolis’s runs only from October 27 to November 15.
Will the first snow close schools?
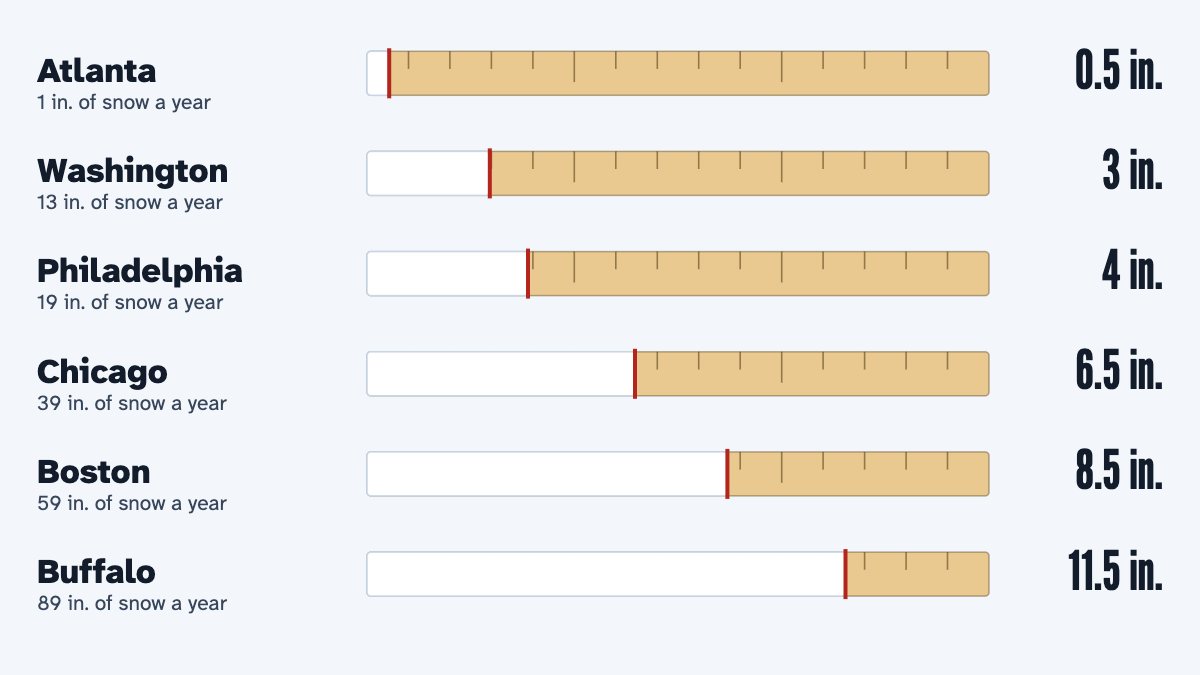
By our rule of thumb, rarely in the North and sometimes in the South. The first measurable snow is often light. In our count, half of the winters had brought a day with an inch or more by November 22 in Minneapolis and by December 4 in Chicago, two to three weeks after their usual first snow (ACIS). By our rule of thumb, it takes around 8 inches in Minneapolis and 6.5 in Chicago to close schools about half the time.
In the South a little goes further. Atlanta’s usual closing point by the same rule is about half an inch, so a first snow that would barely whiten a Chicago lawn can be enough there (how much snow closes school). Ice counts at even smaller amounts, and timing matters: in our calculator, snow that falls overnight or while the buses run counts most.
Whatever falls, only your school district decides, so check its website, app or local TV and radio. For the next school day, the calculator gives the chance of a snow day or a late start at your ZIP code from the same Weather Service forecast as the list above.
What decides the first snow
- Where you live
- Fairbanks by Sep 30
- Chicago by Nov 16
- Atlanta by Feb 1
- How high
- Denver by Oct 12
- a mile up
- This fall
- Alaska and Montana first
- Denver still waiting
- November outlook
- warmer up north
- wetter Southwest
- polar vortex wild card
- El Niño
- very strong one likely
- past ones went both ways
- What counts
- 0.1 inch in a day
- a trace does not
- first inch later
Questions people ask
When is the first snow in 2026?
It depends on where you live. In our count of NOAA records, half of past winters had brought the first measurable snow by November 7 in Minneapolis, November 16 in Chicago and December 9 in New York (ACIS). This fall has started late, and the finder above has 296 cities.
Will it snow in November 2026?
Somewhere, almost certainly, but the odds lean warm. In at least half of the winters from 1991–92 to 2020–21, 115 of the 281 cities on our map with complete enough records had had their first measurable snow by November 30 (ACIS). This year NOAA’s updated outlook of October 31 favors a warmer than normal November across the north, though its forecasters flag a possible polar vortex disruption that could bring cooler spells (CPC). By our reading, that leans against an early start but does not rule out a cold snap with snow.
When does it first snow in Denver, Chicago and New York?
Denver’s average first measurable snow is October 19 (NWS Boulder) and Chicago’s normal date is November 18 (NWS Chicago). In New York’s Central Park, half of the winters from 1991–92 to 2020–21 had had it by December 9, in our count (ACIS).
What counts as the first snowfall?
The first day with 0.1 inch of snow or more at the station, which weather records call measurable snow. Flakes that melt or measure less are a trace and do not count, so a city can see snow in the air weeks before its first snowfall goes on the books. In Buffalo the average gap is about two weeks (NWS Buffalo).
How accurate is a first snowfall forecast?
Snow amounts are forecast only days ahead: the list above reads the first three days of the Weather Service’s forecast, and its amounts can change as a storm’s track shifts. NOAA says snow generally cannot be predicted more than a week ahead (NOAA). Monthly outlooks only tilt the odds of a warmer or wetter month, and the Climate Prediction Center scores them against chance: 0 means no better than a guess, 100 a perfect forecast (CPC verification).
Does El Niño mean less snow?
Not reliably for the first snow. In the three winters from 1991–92 to 2020–21 when El Niño reached the very strong level NOAA thinks likely this winter, the first snow came earlier than usual in most of our cities twice and later once (CPC’s El Niño table, ACIS). NOAA’s outlook for December to February favors a warmer than average northern U.S. and a wetter South, but it does not forecast snowfall (NOAA).
Every city’s first snow
The table has all 296 cities on our map, state by state: the date by which half of the winters had brought measurable snow, the share of winters with it by November 30, the date for the first inch, the record’s average snow a winter beside the city’s normal, and the station the figures come from. A CSV file of it is linked under the table.
When the first measurable snow of the winter (0.1 inch or more in a day) came in 296 U.S. cities (the six largest in each state, Honolulu only in Hawaii, and Washington, D.C.) in the winters of 1991–92 to 2020–21: the date by which half of the winters had brought it, the share of winters with it by November 30, and the date by which half had brought a day with an inch or more, with the record's average snowfall a winter beside the city's normal snowfall, from a NOAA daily station record within 35 miles of each city; for 15 of them the records are too incomplete to say.
Show all 296 cities
| City | First snow, half of winters by | Winters with snow by Nov 30 | First inch, half of winters by | Snow a winter at the record | Normal snowfall a year | Record, distance |
|---|---|---|---|---|---|---|
| Alabama | ||||||
| Huntsville | Jan 18 | 0% | Under half of winters | 2 in. | 1.8 in. | Huntsville Area, 10.8 mi |
| Mobile | Under half of winters | 0% | Under half of winters | 0.2 in. | 0.2 in. | Mobile Area, 6.7 mi |
| Birmingham | Mar 12 | 0% | Under half of winters | 1.4 in. | 1.2 in. | Birmingham Area, 4.1 mi |
| Montgomery | Under half of winters | 0% | Under half of winters | 0.5 in. | 0.2 in. | Montgomery Area, 10.4 mi |
| Tuscaloosa | Under half of winters | 0% | Under half of winters | 1.1 in. | 0.1 in. | Bessemer 3 Wsw, 33.3 mi |
| Hoover | Mar 12 | 0% | Under half of winters | 1.4 in. | 1.2 in. | Birmingham Airport, 12.7 mi |
| Alaska | ||||||
| Anchorage | Oct 17 | 100% | Oct 24 | 77.7 in. | 76.9 in. | Anchorage Area, 8.2 mi |
| Fairbanks | Sep 30 | 100% | Oct 11 | 63.8 in. | 58.6 in. | Fairbanks Area, 5 mi |
| Juneau | Nov 3 | 97% | Nov 10 | 86.8 in. | 84.4 in. | Juneau Area, 1.2 mi |
| Wasilla | Oct 26 | 100% | Oct 27 | 59.1 in. | 66.3 in. | Eagle River 5 Se, 20.6 mi |
| Sitka | Records too incomplete to say | |||||
| Ketchikan | Nov 17 | 68% | Dec 10 | 35.2 in. | 34.8 in. | Annette Airport, 23.5 mi |
| Arizona | ||||||
| Phoenix | Under half of winters | 0% | Under half of winters | 0 in. | 0 in. | Phoenix Area, 8.7 mi |
| Tucson | Under half of winters | 0% | Under half of winters | 0.2 in. | 0.1 in. | Tucson Area, 6.2 mi |
| Mesa | Under half of winters | 0% | Under half of winters | 0 in. | 0 in. | Tempe Asu, 10 mi |
| Gilbert | Under half of winters | 0% | Under half of winters | 0 in. | 0 in. | Tempe Asu, 12.7 mi |
| Chandler | Under half of winters | 0% | Under half of winters | 0 in. | 0 in. | Tempe Asu, 10.5 mi |
| Glendale | Under half of winters | 0% | Under half of winters | 0 in. | 0.1 in. | Phoenix Airport, 15.1 mi |
| Arkansas | ||||||
| Little Rock | Jan 21 | 10% | Feb 14 | 4.2 in. | 3.5 in. | Little Rock Area, 7.4 mi |
| Fayetteville | Dec 23 | 20% | Jan 28 | 6.7 in. | 6.6 in. | Fayetteville Drake Field, 5 mi |
| Fort Smith | Jan 22 | 3% | Feb 14 | 3.6 in. | 2.8 in. | Fort Smith Area, 2.3 mi |
| Springdale | Dec 23 | 20% | Jan 28 | 6.7 in. | 7.7 in. | Fayetteville Drake Field, 12 mi |
| Jonesboro | Jan 14 | 8% | Feb 1 | 4 in. | 3.6 in. | Jonesboro 3 Sse, 2.1 mi |
| Rogers | Dec 23 | 20% | Jan 28 | 6.7 in. | 9 in. | Fayetteville Drake Field, 20.7 mi |
| California | ||||||
| Los Angeles | Under half of winters | 0% | Under half of winters | 0 in. | 0 in. | U C L A, 4.4 mi |
| San Diego | Under half of winters | 0% | Under half of winters | 0 in. | 0 in. | San Diego Area, 5.6 mi |
| San Jose | Records too incomplete to say | |||||
| San Francisco | Records too incomplete to say | |||||
| Fresno | Under half of winters | 0% | Under half of winters | 0 in. | 0 in. | Fresno Area, 3.7 mi |
| Sacramento | Under half of winters | 0% | Under half of winters | 0 in. | 0 in. | Lake Solano, 29.4 mi |
| Colorado | ||||||
| Denver | Oct 12 | 100% | Oct 22 | 49.6 in. | 46.8 in. | Denver-Central Park, 5.2 mi |
| Colorado Springs | Oct 24 | 97% | Nov 12 | 33.4 in. | 43.9 in. | Colorado Springs Area, 6.3 mi |
| Aurora | Oct 29 | 93% | Oct 29 | 58.7 in. | 48.7 in. | Lakewood, 17.5 mi |
| Fort Collins | Oct 24 | 93% | Oct 29 | 52 in. | 50.8 in. | Fort Collins, 2.6 mi |
| Lakewood | Oct 29 | 93% | Oct 29 | 58.7 in. | 59.9 in. | Lakewood, 3.3 mi |
| Thornton | Oct 28 | 97% | Nov 1 | 45.9 in. | 55.3 in. | Northglenn, 2.9 mi |
| Connecticut | ||||||
| Bridgeport | Dec 5 | 38% | Dec 10 | 35.4 in. | 34.8 in. | Bridgeport Area, 4.1 mi |
| Stamford | Dec 5 | 38% | Dec 10 | 35.4 in. | 34.3 in. | Igor I Sikorsky Memorial Airport, 22.5 mi |
| New Haven | Dec 5 | 38% | Dec 10 | 35.4 in. | 36.6 in. | Igor I Sikorsky Memorial Airport, 14.7 mi |
| Hartford | Dec 1 | 46% | Dec 5 | 49.7 in. | 51.3 in. | Hartford Area, 12.1 mi |
| Waterbury | Dec 1 | 46% | Dec 5 | 49.7 in. | 50 in. | Hartford-Bradley International Airport, 31.9 mi |
| Norwalk | Dec 5 | 38% | Dec 10 | 35.4 in. | 35.4 in. | Igor I Sikorsky Memorial Airport, 15.7 mi |
| Delaware | ||||||
| Wilmington | Dec 16 | 20% | Jan 5 | 20.3 in. | 19.4 in. | Wilmington Area, 6.1 mi |
| Dover | Dec 28 | 7% | Jan 18 | 13.6 in. | 13.3 in. | Seabrook Farms, 28.5 mi |
| Newark | Dec 16 | 20% | Jan 5 | 20.3 in. | 19.5 in. | Wilmington Airport, 6.9 mi |
| Middletown | Dec 16 | 20% | Jan 5 | 20.3 in. | 18.1 in. | Wilmington Airport, 14.4 mi |
| Milford | Dec 27 | 0% | Jan 13 | 14.9 in. | 12.9 in. | Cape May 2 Nw, 26.3 mi |
| Smyrna | Dec 28 | 7% | Jan 18 | 13.6 in. | 15 in. | Seabrook Farms, 25.3 mi |
| Washington, D.C. | ||||||
| Washington | Dec 19 | 10% | Jan 8 | 13.7 in. | 12.7 in. | Washington Area, 4.5 mi |
| Florida | ||||||
| Jacksonville | Under half of winters | 0% | Under half of winters | 0 in. | 0 in. | Jacksonville Area, 14.1 mi |
| Miami | Under half of winters | 0% | Under half of winters | 0 in. | 0 in. | Miami Area, 6 mi |
| Tampa | Under half of winters | 0% | Under half of winters | 0 in. | 0 in. | Tampa Area, 5.7 mi |
| Orlando | Under half of winters | 0% | Under half of winters | 0 in. | 0 in. | Orlando Area, 7 mi |
| St. Petersburg | Under half of winters | 0% | Under half of winters | 0 in. | 0 in. | Tampa International Airport, 14.4 mi |
| Port St. Lucie | Under half of winters | 0% | Under half of winters | 0 in. | 0 in. | Vero Beach International Airport, 25.9 mi |
| Georgia | ||||||
| Atlanta | Feb 1 | 3% | Under half of winters | 1.9 in. | 1.1 in. | Atlanta Area, 10 mi |
| Columbus | Under half of winters | 0% | Under half of winters | 0.5 in. | 0.4 in. | Columbus Area, 1.5 mi |
| Augusta | Under half of winters | 0% | Under half of winters | 0.8 in. | 0.8 in. | Augusta Area, 6.9 mi |
| Macon | Records too incomplete to say | |||||
| Savannah | Under half of winters | 0% | Under half of winters | 0.1 in. | 0 in. | Savannah Area, 7.1 mi |
| Athens | Records too incomplete to say | |||||
| Hawaii | ||||||
| Honolulu | Under half of winters | 0% | Under half of winters | 0 in. | 0 in. | Honolulu Area, 6.2 mi |
| Idaho | ||||||
| Boise | Nov 20 | 73% | Nov 30 | 18 in. | 21.7 in. | Boise Area, 3.3 mi |
| Meridian | Nov 20 | 73% | Nov 30 | 18 in. | 18.4 in. | Boise Air Terminal, 8.6 mi |
| Nampa | Records too incomplete to say | |||||
| Caldwell | Dec 22 | 22% | Jan 19 | 6.9 in. | 10.5 in. | Emmett 2 E, 17.2 mi |
| Idaho Falls | Nov 6 | 90% | Nov 8 | 35.1 in. | 43.8 in. | Idaho Falls - Kifi, 2.2 mi |
| Pocatello | Oct 31 | 97% | Nov 18 | 37.7 in. | 40.5 in. | Pocatello Area, 7.3 mi |
| Illinois | ||||||
| Chicago | Nov 16 | 68% | Dec 4 | 39.5 in. | 38.7 in. | Chicago Area, 14.2 mi |
| Aurora | Dec 1 | 48% | Dec 7 | 31.2 in. | 31 in. | Lisle - Morton Arboretum, 11.7 mi |
| Naperville | Dec 1 | 48% | Dec 7 | 31.2 in. | 28.1 in. | Lisle - Morton Arboretum, 6.3 mi |
| Joliet | Dec 5 | 32% | Dec 22 | 18.3 in. | 25.4 in. | Joliet Brandon Road Lock/Dam, 3 mi |
| Rockford | Nov 21 | 68% | Dec 4 | 37 in. | 36.4 in. | Rockford Area, 5.7 mi |
| Elgin | Dec 1 | 48% | Dec 5 | 32 in. | 37.7 in. | Elgin Water, 2 mi |
| Indiana | ||||||
| Indianapolis | Nov 23 | 63% | Dec 7 | 25.8 in. | 24.5 in. | Indianapolis Area, 8.5 mi |
| Fort Wayne | Nov 15 | 77% | Dec 5 | 33.5 in. | 33.2 in. | Fort Wayne Area, 9.1 mi |
| Evansville | Dec 8 | 32% | Dec 30 | 11.2 in. | 10.8 in. | Evansville Area, 4.7 mi |
| Fishers | Dec 5 | 38% | Dec 20 | 20.3 in. | 21.4 in. | Greenfield, 16.8 mi |
| South Bend | Nov 9 | 80% | Nov 22 | 65.8 in. | 58.9 in. | South Bend Area, 4 mi |
| Carmel | Dec 5 | 40% | Dec 10 | 23.4 in. | 21.8 in. | Whitestown, 11.6 mi |
| Iowa | ||||||
| Des Moines | Nov 11 | 73% | Nov 27 | 37.5 in. | 34.2 in. | Des Moines Area, 4 mi |
| Cedar Rapids | Nov 13 | 73% | Dec 1 | 33.2 in. | 32.7 in. | Cedar Rapids No. 1, 5.9 mi |
| Davenport | Nov 20 | 63% | Dec 1 | 36.5 in. | 35.1 in. | Moline Quad City International Airport, 7.9 mi |
| Sioux City | Nov 7 | 87% | Nov 23 | 36 in. | 35.6 in. | Sioux City Area, 7.9 mi |
| Ankeny | Dec 3 | 44% | Dec 3 | 23.7 in. | 32.7 in. | Ankeny, 2.2 mi |
| Iowa City | Dec 1 | 48% | Dec 1 | 27.3 in. | 27.8 in. | Iowa City, 3.7 mi |
| Kansas | ||||||
| Wichita | Dec 3 | 47% | Dec 12 | 13 in. | 11.9 in. | Wichita Area, 5.7 mi |
| Overland Park | Nov 30 | 50% | Dec 12 | 17.2 in. | 14.2 in. | Bonner Springs, 15.1 mi |
| Kansas City | Dec 3 | 48% | Dec 14 | 17.5 in. | 15.8 in. | Kansas City Area, 13.1 mi |
| Olathe | Nov 30 | 50% | Dec 12 | 17.2 in. | 14.6 in. | Bonner Springs, 13.7 mi |
| Topeka | Nov 29 | 50% | Dec 14 | 16.8 in. | 15.9 in. | Topeka Area, 4.6 mi |
| Lawrence | Nov 29 | 50% | Dec 14 | 16.8 in. | 12.1 in. | Topeka Asos, 20.9 mi |
| Kentucky | ||||||
| Louisville | Dec 2 | 43% | Dec 31 | 14.9 in. | 12.3 in. | Louisville Area, 2.9 mi |
| Lexington | Dec 5 | 40% | Jan 6 | 14.8 in. | 13.6 in. | Lexington Area, 6.4 mi |
| Bowling Green | Dec 30 | 17% | Jan 10 | 8.3 in. | 8.2 in. | Bowling Green Warren County Airport, 0.8 mi |
| Owensboro | Dec 17 | 19% | Dec 24 | 12.1 in. | 6.7 in. | Boonville 1S, 21.3 mi |
| Covington | Nov 29 | 57% | Dec 6 | 24 in. | 20.1 in. | Cincinnati/Northern Kentucky International Airport, 7.8 mi |
| Georgetown | Dec 5 | 40% | Jan 6 | 14.8 in. | 13.9 in. | Lexington Bluegrass Airport, 13 mi |
| Louisiana | ||||||
| New Orleans | Under half of winters | 0% | Under half of winters | 0 in. | 0 in. | New Orleans Area, 13.5 mi |
| Baton Rouge | Under half of winters | 0% | Under half of winters | 0.3 in. | 0.1 in. | Baton Rouge Area, 6.9 mi |
| Shreveport | Mar 12 | 0% | Under half of winters | 1.1 in. | 0.8 in. | Shreveport Area, 3.2 mi |
| Lafayette | Records too incomplete to say | |||||
| Lake Charles | Records too incomplete to say | |||||
| Kenner | Under half of winters | 0% | Under half of winters | 0 in. | 0 in. | New Orleans Airport, 2.1 mi |
| Maine | ||||||
| Portland | Nov 25 | 60% | Dec 3 | 69.2 in. | 72.9 in. | Portland Area, 2.5 mi |
| Lewiston | Nov 21 | 79% | Dec 1 | 76 in. | 75.2 in. | Durham, 8.3 mi |
| Bangor | Nov 24 | 66% | Nov 26 | 74.5 in. | 74.5 in. | Bangor Area, 2 mi |
| South Portland | Nov 25 | 60% | Dec 3 | 69.2 in. | 70.1 in. | Portland Jetport, 1.8 mi |
| Auburn | Nov 21 | 79% | Dec 1 | 76 in. | 75.2 in. | Durham, 9.6 mi |
| Sanford | Dec 3 | 37% | Dec 9 | 45.6 in. | 64.2 in. | Sanford 2 Nnw, 1.7 mi |
| Maryland | ||||||
| Baltimore | Dec 10 | 20% | Dec 26 | 19.4 in. | 20.9 in. | Baltimore Area, 10.4 mi |
| Frederick | Dec 11 | 23% | Dec 19 | 31 in. | 31 in. | Emmitsburg 2 Se, 18.3 mi |
| Gaithersburg | Dec 6 | 29% | Dec 16 | 30.9 in. | 25 in. | Damascus 3 Ssw, 9.1 mi |
| Rockville | Dec 14 | 14% | Dec 20 | 15.5 in. | 17.6 in. | Beltsville, 12.2 mi |
| Bowie | Dec 14 | 14% | Dec 20 | 15.5 in. | 15.9 in. | Beltsville, 10.9 mi |
| Hagerstown | Dec 8 | 27% | Dec 16 | 27.6 in. | 31.4 in. | Hagerstown 1E, 1.5 mi |
| Massachusetts | ||||||
| Boston | Dec 1 | 47% | Dec 8 | 49.3 in. | 59.1 in. | Boston Area, 4.8 mi |
| Worcester | Nov 17 | 67% | Nov 28 | 74.5 in. | 60.8 in. | Worcester Area, 3.5 mi |
| Springfield | Dec 1 | 46% | Dec 5 | 49.7 in. | 46.6 in. | Hartford-Bradley International Airport, 13.8 mi |
| Cambridge | Dec 1 | 47% | Dec 8 | 49.3 in. | 59 in. | Boston Logan International Airport, 5.3 mi |
| Lowell | Dec 3 | 38% | Dec 3 | 38.9 in. | 63.2 in. | Lawrence, 8.8 mi |
| Brockton | Dec 2 | 48% | Dec 6 | 49.8 in. | 56 in. | Norton West, 9.7 mi |
| Michigan | ||||||
| Detroit | Nov 19 | 77% | Dec 6 | 45 in. | 35 in. | Detroit Area, 15.5 mi |
| Grand Rapids | Nov 9 | 100% | Nov 24 | 76.7 in. | 75 in. | Grand Rapids Area, 8.5 mi |
| Warren | Nov 19 | 77% | Dec 6 | 45 in. | 30.6 in. | Detroit Metro Airport, 23.9 mi |
| Sterling Heights | Nov 19 | 77% | Dec 6 | 45 in. | 32.8 in. | Detroit Metro Airport, 28.5 mi |
| Ann Arbor | Nov 11 | 92% | Nov 22 | 61.3 in. | 57.7 in. | Ann Arbor U Of Mich, 4.1 mi |
| Lansing | Nov 9 | 86% | Nov 23 | 49.7 in. | 42.2 in. | Lansing Area, 5 mi |
| Minnesota | ||||||
| Minneapolis | Nov 7 | 100% | Nov 22 | 52.2 in. | 51.1 in. | Minneapolis-St Paul Area, 5.6 mi |
| St. Paul | Nov 7 | 100% | Nov 22 | 52.2 in. | 49.4 in. | Minneapolis-St Paul Area, 7.7 mi |
| Rochester | Nov 2 | 100% | Nov 15 | 52.9 in. | 50.7 in. | Rochester Area, 9.2 mi |
| Bloomington | Nov 7 | 100% | Nov 22 | 52.2 in. | 51.4 in. | Minneapolis-St. Paul International Airport, 5.5 mi |
| Duluth | Oct 24 | 100% | Nov 7 | 88.2 in. | 80.8 in. | Duluth Area, 5.3 mi |
| Brooklyn Park | Nov 7 | 100% | Nov 15 | 53.1 in. | 51.9 in. | New Hope, 6.6 mi |
| Mississippi | ||||||
| Jackson | Jan 29 | 0% | Under half of winters | 1 in. | 1 in. | Jackson Area, 7.1 mi |
| Gulfport | Records too incomplete to say | |||||
| Southaven | Jan 7 | 14% | Feb 10 | 3 in. | 1.9 in. | Memphis International Airport, 7 mi |
| Hattiesburg | Under half of winters | 0% | Under half of winters | 0.9 in. | 0.7 in. | Hattiesburg 5SW, 4.1 mi |
| Biloxi | Records too incomplete to say | |||||
| Olive Branch | Jan 7 | 14% | Feb 10 | 3 in. | 1.8 in. | Memphis International Airport, 11.3 mi |
| Missouri | ||||||
| Kansas City | Dec 3 | 48% | Dec 14 | 17.5 in. | 13 in. | Kansas City Area, 17.1 mi |
| St. Louis | Dec 1 | 47% | Dec 12 | 16.8 in. | 14.3 in. | St Louis Area, 11.1 mi |
| Springfield | Dec 6 | 41% | Jan 1 | 14 in. | 12.5 in. | Springfield Area, 6.9 mi |
| Columbia | Dec 4 | 43% | Dec 13 | 16.2 in. | 16.8 in. | Columbia Area, 10.7 mi |
| Independence | Dec 7 | 40% | Dec 10 | 16.7 in. | 11.5 in. | Pleasant Hill Weather Office, 19.4 mi |
| Lee's Summit | Dec 7 | 40% | Dec 10 | 16.7 in. | 12.2 in. | Pleasant Hill Weather Office, 9.4 mi |
| Montana | ||||||
| Billings | Oct 13 | 100% | Oct 17 | 56.4 in. | 50.5 in. | Billings Area, 1.9 mi |
| Missoula | Nov 3 | 93% | Nov 10 | 42.8 in. | 44.6 in. | Missoula Area, 5.7 mi |
| Great Falls | Oct 4 | 100% | Oct 12 | 64.8 in. | 65.1 in. | Great Falls Area, 5.4 mi |
| Bozeman | Oct 8 | 100% | Oct 17 | 93.1 in. | 80.2 in. | Bozeman Montana State University, 2.1 mi |
| Butte | Oct 4 | 100% | Oct 22 | 75.8 in. | 37.7 in. | Anaconda, 23.2 mi |
| Helena | Oct 26 | 100% | Oct 28 | 37.3 in. | 37 in. | Helena Area, 2.1 mi |
| Nebraska | ||||||
| Omaha | Nov 14 | 79% | Nov 27 | 27.6 in. | 30 in. | Omaha Area, 8.6 mi |
| Lincoln | Nov 21 | 66% | Dec 3 | 26.8 in. | 27.2 in. | Lincoln Area, 5.7 mi |
| Bellevue | Nov 14 | 79% | Nov 27 | 27.4 in. | 27.5 in. | Omaha Eppley Airfield, 11.2 mi |
| Grand Island | Nov 11 | 86% | Nov 28 | 27.3 in. | 27.2 in. | Grand Island Area, 3.6 mi |
| Kearney | Nov 15 | 80% | Nov 15 | 24.1 in. | 22.8 in. | Kearney 4 Ne, 4.1 mi |
| Fremont | Nov 21 | 70% | Dec 1 | 30.2 in. | 29.8 in. | Fremont, 1.7 mi |
| Nevada | ||||||
| Las Vegas | Under half of winters | 0% | Under half of winters | 0.2 in. | 0.2 in. | Las Vegas Area, 9.6 mi |
| Henderson | Under half of winters | 0% | Under half of winters | 0.2 in. | 0.2 in. | Harry Reid International Airport, 7.3 mi |
| North Las Vegas | Under half of winters | 0% | Under half of winters | 0.2 in. | 0.2 in. | Harry Reid International Airport, 11.9 mi |
| Reno | Nov 10 | 72% | Dec 4 | 30 in. | 25 in. | Reno Weather Office, 3.3 mi |
| Sparks | Nov 10 | 72% | Dec 4 | 30 in. | 25 in. | Reno Weather Office, 3 mi |
| Carson City | Nov 10 | 72% | Dec 4 | 30 in. | 25.4 in. | Reno Weather Office, 28 mi |
| New Hampshire | ||||||
| Manchester | Dec 2 | 46% | Dec 3 | 55.3 in. | 57.5 in. | Nashua 2 Nnw, 13.7 mi |
| Nashua | Dec 2 | 46% | Dec 3 | 55.3 in. | 62 in. | Nashua 2 Nnw, 3 mi |
| Concord | Nov 20 | 76% | Dec 1 | 67.5 in. | 66.6 in. | Concord Area, 2.4 mi |
| Dover | Dec 5 | 38% | Dec 6 | 40.1 in. | 56.1 in. | Durham, 4.9 mi |
| Rochester | Dec 5 | 38% | Dec 6 | 40.1 in. | 50.6 in. | Durham, 11.1 mi |
| Keene | Nov 24 | 63% | Dec 3 | 60.2 in. | 65.2 in. | Keene, 1.8 mi |
| New Jersey | ||||||
| Newark | Dec 8 | 27% | Dec 17 | 32.4 in. | 29 in. | Newark Area, 4 mi |
| Jersey City | Dec 8 | 27% | Dec 17 | 32.4 in. | 29.8 in. | Newark Liberty International Airport, 6.2 mi |
| Paterson | Dec 9 | 20% | Dec 16 | 30.3 in. | 29.4 in. | Ny City Central Park, 13.9 mi |
| Elizabeth | Dec 8 | 27% | Dec 17 | 32.4 in. | 29.1 in. | Newark Liberty International Airport, 2.6 mi |
| Trenton | Dec 8 | 23% | Dec 26 | 27.3 in. | 25 in. | Trenton Area, 4.8 mi |
| Clifton | Dec 9 | 20% | Dec 16 | 30.3 in. | 29.4 in. | Ny City Central Park, 11.4 mi |
| New Mexico | ||||||
| Albuquerque | Nov 28 | 55% | Dec 16 | 8.2 in. | 12.6 in. | Albuquerque Area, 5.5 mi |
| Las Cruces | Jan 22 | 11% | Under half of winters | 1.1 in. | 1 in. | State University, 2 mi |
| Rio Rancho | Nov 28 | 55% | Dec 16 | 8.2 in. | 8.4 in. | Albuquerque International Airport, 15.6 mi |
| Santa Fe | Nov 23 | 54% | Nov 23 | 16.9 in. | 23.5 in. | Santa Fe 2, 2.6 mi |
| Roswell | Dec 1 | 48% | Dec 5 | 8.4 in. | 8.1 in. | Roswell Area, 5.2 mi |
| Farmington | Nov 29 | 55% | Dec 26 | 8.8 in. | 8.6 in. | Farmington Ag Science Cnt, 9 mi |
| New York | ||||||
| New York | Dec 9 | 20% | Dec 16 | 30.3 in. | 28.5 in. | New York-Central Park Area, 4.5 mi |
| Buffalo | Nov 7 | 90% | Nov 17 | 95.6 in. | 88.6 in. | Buffalo Area, 5.9 mi |
| Yonkers | Dec 8 | 23% | Dec 17 | 30.2 in. | 30 in. | Laguardia Airport, 10.9 mi |
| Rochester | Nov 8 | 97% | Nov 18 | 101.9 in. | 92.3 in. | Rochester Area, 4.5 mi |
| Syracuse | Nov 7 | 97% | Nov 18 | 126.8 in. | 120.5 in. | Syracuse Area, 5.2 mi |
| Albany | Nov 14 | 79% | Nov 26 | 59.3 in. | 57 in. | Albany Area, 5.9 mi |
| North Carolina | ||||||
| Charlotte | Jan 18 | 3% | Jan 29 | 3.4 in. | 3.2 in. | Charlotte Area, 7.8 mi |
| Raleigh | Jan 17 | 7% | Jan 28 | 5.2 in. | 4.9 in. | Raleigh Area, 8.9 mi |
| Greensboro | Jan 8 | 7% | Jan 18 | 7.2 in. | 6.3 in. | Greensboro Area, 6.6 mi |
| Durham | Jan 17 | 7% | Jan 28 | 5.2 in. | 4.5 in. | Raleigh-Durham International Airport, 9 mi |
| Winston-Salem | Jan 9 | 0% | Jan 17 | 7.6 in. | 6.5 in. | Yadkinville 6 E, 15.4 mi |
| Fayetteville | Records too incomplete to say | |||||
| North Dakota | ||||||
| Fargo | Oct 29 | 97% | Nov 4 | 50.4 in. | 50.5 in. | Fargo Area, 4.8 mi |
| Bismarck | Oct 28 | 97% | Nov 7 | 49.6 in. | 50 in. | Bismarck Area, 2.3 mi |
| Grand Forks | Oct 26 | 97% | Nov 8 | 47.4 in. | 48.4 in. | Grand Forks Area, 6 mi |
| Minot | Oct 23 | 100% | Oct 24 | 50.8 in. | 48.4 in. | Minot Experiment Station, 3.9 mi |
| West Fargo | Oct 29 | 97% | Nov 4 | 50.4 in. | 50.3 in. | Fargo Hector International Airport, 6.7 mi |
| Williston | Oct 20 | 100% | Oct 30 | 49.3 in. | 44 in. | Williston Area, 0.2 mi |
| Ohio | ||||||
| Columbus | Nov 20 | 67% | Dec 7 | 28.3 in. | 24 in. | Columbus Area, 5.9 mi |
| Cleveland | Nov 9 | 93% | Nov 23 | 63.7 in. | 64.7 in. | Cleveland Area, 10.3 mi |
| Cincinnati | Nov 29 | 57% | Dec 6 | 24 in. | 18.5 in. | Cincinnati Area, 11.1 mi |
| Toledo | Nov 22 | 67% | Dec 5 | 36.6 in. | 35 in. | Toledo Area, 12.5 mi |
| Akron | Nov 7 | 87% | Nov 22 | 47 in. | 46.1 in. | Akron Area, 11.6 mi |
| Dayton | Nov 29 | 62% | Dec 9 | 26.2 in. | 19.8 in. | Dayton Area, 9.5 mi |
| Oklahoma | ||||||
| Oklahoma City | Dec 15 | 33% | Dec 24 | 7.4 in. | 6.2 in. | Oklahoma City Area, 6.8 mi |
| Tulsa | Dec 9 | 33% | Jan 8 | 9 in. | 8.4 in. | Tulsa Area, 6.5 mi |
| Norman | Dec 15 | 33% | Dec 24 | 7.4 in. | 5.2 in. | Oklahoma City Will Rogers World Airport, 15.1 mi |
| Broken Arrow | Dec 9 | 33% | Jan 8 | 9 in. | 7.5 in. | Tulsa International Airport, 11.9 mi |
| Edmond | Dec 15 | 33% | Dec 24 | 7.4 in. | 4.8 in. | Oklahoma City Will Rogers World Airport, 20.1 mi |
| Lawton | Dec 24 | 24% | Dec 28 | 5.6 in. | 1.7 in. | Marlow 1 Wsw, 26.4 mi |
| Oregon | ||||||
| Portland | Jan 10 | 10% | Feb 6 | 4.6 in. | 3.6 in. | Portland Area, 5.3 mi |
| Salem | Records too incomplete to say | |||||
| Eugene | Under half of winters | 4% | Under half of winters | 2.7 in. | 2.2 in. | Cottage Grove 2E, 19.3 mi |
| Gresham | Under half of winters | 4% | Under half of winters | 2.7 in. | 4.1 in. | Forest Grove, 31.6 mi |
| Hillsboro | Under half of winters | 4% | Under half of winters | 2.7 in. | 4 in. | Forest Grove, 8.9 mi |
| Bend | Records too incomplete to say | |||||
| Pennsylvania | ||||||
| Philadelphia | Dec 16 | 13% | Jan 6 | 23.5 in. | 18.7 in. | Philadelphia Area, 10.1 mi |
| Pittsburgh | Nov 13 | 77% | Dec 1 | 45.1 in. | 34.7 in. | Pittsburgh Area, 13.2 mi |
| Allentown | Dec 5 | 37% | Dec 11 | 34.7 in. | 33.5 in. | Allentown Area, 3.7 mi |
| Reading | Dec 5 | 40% | Dec 16 | 29.6 in. | 26.5 in. | Reading Area, 2.8 mi |
| Erie | Nov 11 | 96% | Nov 17 | 105 in. | 108.4 in. | Erie Area, 6 mi |
| Bethlehem | Dec 5 | 37% | Dec 11 | 34.7 in. | 34.2 in. | Allentown Lehigh Valley International Airport, 3.7 mi |
| Rhode Island | ||||||
| Providence | Dec 1 | 48% | Dec 7 | 38.4 in. | 44.4 in. | Providence Area, 6.9 mi |
| Cranston | Dec 1 | 48% | Dec 7 | 38.4 in. | 45.2 in. | Rhode Island T.f. Green International Airport, 3.9 mi |
| Warwick | Dec 1 | 48% | Dec 7 | 38.4 in. | 35 in. | Rhode Island T.f. Green International Airport, 0.7 mi |
| Pawtucket | Dec 1 | 48% | Dec 7 | 38.4 in. | 43.4 in. | Rhode Island T.f. Green International Airport, 11 mi |
| East Providence | Dec 1 | 48% | Dec 7 | 38.4 in. | 41.4 in. | Rhode Island T.f. Green International Airport, 6.8 mi |
| Woonsocket | Dec 5 | 32% | Dec 9 | 40 in. | 44.7 in. | Woonsocket, 0.8 mi |
| South Carolina | ||||||
| Charleston | Under half of winters | 0% | Under half of winters | 0.4 in. | 0.3 in. | Charleston Area, 7.9 mi |
| Columbia | Mar 13 | 0% | Under half of winters | 1.2 in. | 0.9 in. | Columbia Area, 8.2 mi |
| North Charleston | Under half of winters | 0% | Under half of winters | 0.4 in. | 0.3 in. | Charleston Intl. Airport, 2.2 mi |
| Mount Pleasant | Under half of winters | 0% | Under half of winters | 0.4 in. | 0.3 in. | Charleston Intl. Airport, 12.7 mi |
| Rock Hill | Jan 22 | 4% | Feb 26 | 2.6 in. | 1.7 in. | Winthrop University, 0.7 mi |
| Greenville | Jan 17 | 7% | Jan 25 | 3.8 in. | 3.1 in. | Greenville-Spartanburg Area, 9.8 mi |
| South Dakota | ||||||
| Sioux Falls | Nov 6 | 97% | Nov 6 | 45.3 in. | 45.5 in. | Sioux Falls Area, 3.7 mi |
| Rapid City | Oct 16 | 100% | Nov 3 | 53.4 in. | 48.4 in. | Rapid City Weather Office, 0.6 mi |
| Aberdeen | Oct 29 | 97% | Nov 11 | 41.9 in. | 42.1 in. | Aberdeen Area, 3.4 mi |
| Brookings | Nov 7 | 93% | Nov 16 | 36.5 in. | 36.1 in. | Brookings 2 Ne, 1.9 mi |
| Watertown | Nov 3 | 93% | Nov 5 | 57.1 in. | 37.4 in. | Summit 1 W, 27.5 mi |
| Yankton | Nov 7 | 88% | Nov 16 | 39.3 in. | 38.3 in. | Yankton 2 E, 2.1 mi |
| Tennessee | ||||||
| Nashville | Dec 29 | 20% | Feb 6 | 4.6 in. | 3.6 in. | Nashville Area, 3.6 mi |
| Memphis | Jan 7 | 14% | Feb 10 | 3 in. | 2.5 in. | Memphis Area, 5.1 mi |
| Knoxville | Jan 7 | 4% | Jan 20 | 5 in. | 4.4 in. | Oak Ridge Atdd, 14.3 mi |
| Chattanooga | Under half of winters | 0% | Under half of winters | 1.3 in. | 1.6 in. | Cleveland Filter Plant, 27.2 mi |
| Clarksville | Mar 8 | 0% | Under half of winters | 1.4 in. | 1.3 in. | Cheatham Lock & Dam, 19.5 mi |
| Murfreesboro | Dec 29 | 20% | Feb 6 | 4.6 in. | 2.3 in. | Nashville International Airport, 23.4 mi |
| Texas | ||||||
| Houston | Under half of winters | 0% | Under half of winters | 0.1 in. | 0 in. | Houston Area, 16 mi |
| San Antonio | Under half of winters | 0% | Under half of winters | 0.4 in. | 0.2 in. | San Antonio Area, 5 mi |
| Dallas | Feb 12 | 3% | Under half of winters | 1.8 in. | 1.4 in. | Dallas-Fort Worth Area, 14.9 mi |
| Fort Worth | Feb 12 | 3% | Under half of winters | 1.8 in. | 1.5 in. | Dallas-Fort Worth Area, 19.8 mi |
| Austin | Under half of winters | 0% | Under half of winters | 0.4 in. | 0.2 in. | Austin Area, 1.1 mi |
| El Paso | Dec 28 | 14% | Jan 3 | 2.4 in. | 2.4 in. | El Paso Area, 2.3 mi |
| Utah | ||||||
| Salt Lake City | Nov 5 | 97% | Nov 21 | 51.1 in. | 60.1 in. | Salt Lake City Area, 3.8 mi |
| West Valley City | Nov 5 | 97% | Nov 21 | 51.1 in. | 48.9 in. | Salt Lake City International Airport, 6.3 mi |
| West Jordan | Nov 6 | 90% | Nov 19 | 43.7 in. | 57.9 in. | Provo Byu, 30.7 mi |
| Provo | Nov 6 | 90% | Nov 19 | 43.7 in. | 51.9 in. | Provo Byu, 0.8 mi |
| St. George | Under half of winters | 0% | Under half of winters | 1 in. | 1.7 in. | St. George, 3.4 mi |
| Orem | Nov 6 | 90% | Nov 19 | 43.7 in. | 45 in. | Provo Byu, 4.6 mi |
| Vermont | ||||||
| Burlington | Nov 7 | 97% | Nov 20 | 86.6 in. | 76.2 in. | Burlington Area, 3.5 mi |
| South Burlington | Nov 7 | 97% | Nov 20 | 86.6 in. | 79.6 in. | Burlington International Airport, 2 mi |
| Rutland | Nov 9 | 90% | Nov 16 | 74.7 in. | 79.2 in. | Rutland, 1.1 mi |
| Essex Junction | Nov 7 | 97% | Nov 20 | 86.6 in. | 79.5 in. | Burlington International Airport, 3.7 mi |
| Winooski | Nov 7 | 97% | Nov 20 | 86.6 in. | 76.3 in. | Burlington International Airport, 2.6 mi |
| Barre | Nov 2 | 100% | Nov 17 | 87.7 in. | 95.1 in. | Saint Johnsbury, 28.3 mi |
| Virginia | ||||||
| Virginia Beach | Jan 17 | 0% | Jan 28 | 5.5 in. | 5.2 in. | Norfolk International Airport, 7.6 mi |
| Chesapeake | Jan 17 | 0% | Jan 28 | 5.5 in. | 5.3 in. | Norfolk International Airport, 11.4 mi |
| Richmond | Dec 27 | 7% | Jan 7 | 9.1 in. | 9.9 in. | Richmond Area, 8.3 mi |
| Norfolk | Jan 17 | 0% | Jan 28 | 5.5 in. | 5.1 in. | Norfolk Area, 3.8 mi |
| Newport News | Jan 17 | 0% | Jan 28 | 5.5 in. | 3.7 in. | Norfolk International Airport, 21.1 mi |
| Alexandria | Dec 19 | 10% | Jan 8 | 13.7 in. | 11.8 in. | Washington Reagan National Airport, 3.5 mi |
| Washington | ||||||
| Seattle | Dec 20 | 19% | Jan 19 | 6.1 in. | 4.2 in. | Seattle Tacoma Area, 12.8 mi |
| Spokane | Nov 12 | 96% | Nov 13 | 46.6 in. | 45.3 in. | Spokane Area, 6.5 mi |
| Tacoma | Dec 20 | 19% | Jan 19 | 6.1 in. | 4.2 in. | Seattle Tacoma Area, 15.9 mi |
| Vancouver | Jan 10 | 10% | Feb 6 | 4.6 in. | 3.1 in. | Portland International Airport, 3.4 mi |
| Bellevue | Dec 20 | 19% | Jan 19 | 6.1 in. | 4.2 in. | Seattle Tacoma Airport, 13.1 mi |
| Kent | Dec 20 | 19% | Jan 19 | 6.1 in. | 7.4 in. | Seattle Tacoma Airport, 6.3 mi |
| West Virginia | ||||||
| Charleston | Nov 23 | 60% | Dec 5 | 28.9 in. | 26.1 in. | Charleston Area, 3 mi |
| Huntington | Dec 7 | 38% | Dec 30 | 17.2 in. | 11.7 in. | Huntington Area, 8.7 mi |
| Morgantown | Dec 5 | 37% | Dec 19 | 24.4 in. | 19.1 in. | Clarksburg 1, 33.8 mi |
| Parkersburg | Dec 11 | 31% | Dec 22 | 21.1 in. | 14.1 in. | Newport, 19.8 mi |
| Wheeling | Dec 11 | 33% | Dec 22 | 16 in. | 16.1 in. | Pike Island(Lock And Dam), 5.6 mi |
| Martinsburg | Dec 8 | 27% | Dec 16 | 27.6 in. | 27.3 in. | Hagerstown 1E, 19 mi |
| Wisconsin | ||||||
| Milwaukee | Nov 11 | 83% | Dec 1 | 49.5 in. | 47 in. | Milwaukee Area, 7.4 mi |
| Madison | Nov 9 | 83% | Nov 23 | 51.3 in. | 47.3 in. | Madison Area, 5.3 mi |
| Green Bay | Nov 11 | 87% | Nov 25 | 55.3 in. | 56.4 in. | Green Bay Area, 6.6 mi |
| Kenosha | Nov 11 | 83% | Dec 1 | 49.5 in. | 39.3 in. | Milwaukee Mitchell Airport, 25.9 mi |
| Racine | Nov 11 | 83% | Dec 1 | 49.5 in. | 42.1 in. | Milwaukee Mitchell Airport, 16.4 mi |
| Appleton | Nov 16 | 80% | Nov 28 | 49 in. | 48.8 in. | Appleton, 2.4 mi |
| Wyoming | ||||||
| Cheyenne | Oct 6 | 100% | Oct 8 | 64.4 in. | 61 in. | Cheyenne Area, 1.7 mi |
| Casper | Oct 4 | 100% | Oct 7 | 72.9 in. | 74.1 in. | Casper Area, 9.7 mi |
| Gillette | Oct 10 | 97% | Oct 17 | 54.1 in. | 54.8 in. | Gillette 3SE, 3.3 mi |
| Laramie | Oct 2 | 100% | Oct 10 | 93.3 in. | 68 in. | Virginia Dale 7 Ene, 30.7 mi |
| Rock Springs | Records too incomplete to say | |||||
| Sheridan | Records too incomplete to say | |||||
Built from: Applied Climate Information System (ACIS): daily station records (NOAA Regional Climate Centers); Global Historical Climatology Network daily (GHCN-Daily) (National Centers for Environmental Information).
Sources: NOAA Regional Climate Centers, Applied Climate Information System (ACIS): daily station records; NOAA Climate Prediction Center, 30-Day Outlook Discussion; National Oceanic and Atmospheric Administration, El Niño looms large over U.S. winter outlook.
Facts checked November 1, 2026.
More guides
-

-
-
-
-

-
-