How the Snow Day Calculator Works: Every Rule, With Its Data
The calculator reads the National Weather Service forecast for your ZIP code and compares the snow, ice and cold with what usually closes schools where you live. Here is every rule.

The calculator turns a National Weather Service forecast into three chances that add up to 100%: a snow day, a late start, or school as usual. It reads the forecast for the part of your ZIP code where most people live, counts the snow and ice expected before and during the school day by when they fall, checks the wind chill at bus-stop time and any winter warning in force, and compares all of that with what usually closes schools where you live. By our rule of thumb, places that rarely see snow close for half an inch, and snowy places need far more.
Every rule is below, with the data behind it. The same rules run on our server and in your browser, and nothing here is secret: every number the calculator uses is on this page, so you can work a chance out by hand.
Where does the forecast come from?
From the National Weather Service’s own forecast service, the same forecast its offices publish, for a grid of squares about 2.5 kilometers across: temperature, wind chill and gusts hour by hour, and snow and ice as totals for 1 to 6 hours at a time, which the calculator shares evenly across their hours. For each ZIP code the calculator asks which grid square holds the ZIP code’s point, then reads that square’s snow, ice, temperature, wind chill and gusts for the next few days, and the winter alerts in force for its forecast zone and county.
Forecasts are kept for 45 minutes, so the thousands of people checking on a storm night all get the same, fresh numbers without overloading the Weather Service; an answer whose forecast is older says how old it is. If the service does not answer, the calculator uses its last forecast for up to six hours. The Weather Service’s data drops hours as they pass, so the calculator keeps each grid square’s past hours for 36 hours: snow that fell yesterday afternoon still counts tonight, for any place someone has asked about since then (the map’s 296 cities are asked about every half hour). Where it holds no such hours, the answer says from when it could not count the snow. Alerts are read every 5 minutes and kept for up to 6 hours if the service fails, without the ones that have ended; an alert with no end time counts until its message expires, or for 12 hours from its start. When no alerts can be read at all, the answer says so. The answer always shows when the Weather Service last updated the forecast, with a link to its own forecast for the same spot.
Where is my ZIP code?
A ZIP code is a mail route, not an area, so the calculator uses the U.S. Census Bureau’s ZIP Code Tabulation Areas, the areas the Census draws for ZIP codes, from its 2026 Gazetteer files. It reads the forecast where most of a ZIP code’s people live, not at the middle of its land: from the Census Bureau’s 2020 centers of population for its census tracts, each counted by its people and by how much of it lies in the ZIP code (the Census’s relationship files say which tracts those are). That matters in big rural ZIP codes: most of the land of 99701, Fairbanks, Alaska, lies in the wilderness to the north, so the middle of its land is near Wiseman, about 185 miles away, while its people are in Fairbanks. ZIP codes used only for PO boxes or a single building have no area of their own; for those, type the ZIP code of the school’s street. The answer names the nearest town the Weather Service gives, so you can see where it was worked out.
Which school day does it look at?
The next one. Before 7 AM on a weekday, that is today; after 7 AM, or on a weekend, it is the next weekday. The calculator shows up to three school days, as far as the Weather Service’s snow forecast reaches. A day gets chances only when the forecast covers its night and morning: if more than 6 of the 12 hours from 9 PM to 9 AM have no forecast, the answer says the day is not in the forecast yet instead of guessing. It does not skip holidays, because schools differ, but it names the ones most schools close for anyway, such as Martin Luther King Jr. Day and the days around Thanksgiving and winter break.
How is the snow counted?
Snow that is on the roads when buses start matters most. So the calculator reads the forecast hour by hour from 6 AM the day before to 3 PM on the school day and counts each inch by when it falls:
- 9 PM to 6 AM, overnight: in full.
- 6 AM to 10 AM, while buses run: in full.
- Noon to 9 PM the day before: 80%, because crews have the night to clear it.
- 10 AM to 3 PM on the day: 45% toward a closing, because snow during the school day more often brings an early dismissal than a closed day. It does not count toward a late start.
- 6 AM to noon the day before: 35%.
Snow that falls when it is above freezing counts for less, because roads stay wet or slushy: three-quarters of it between 32°F and 35°F, half above 35°F. When gusts reach 25 mph in a snowy hour between 9 PM and 10 AM, and an inch or more counts in all, the snow counts 10% more, and 20% more at 35 mph, for blowing and drifting.
How much snow usually closes schools here?
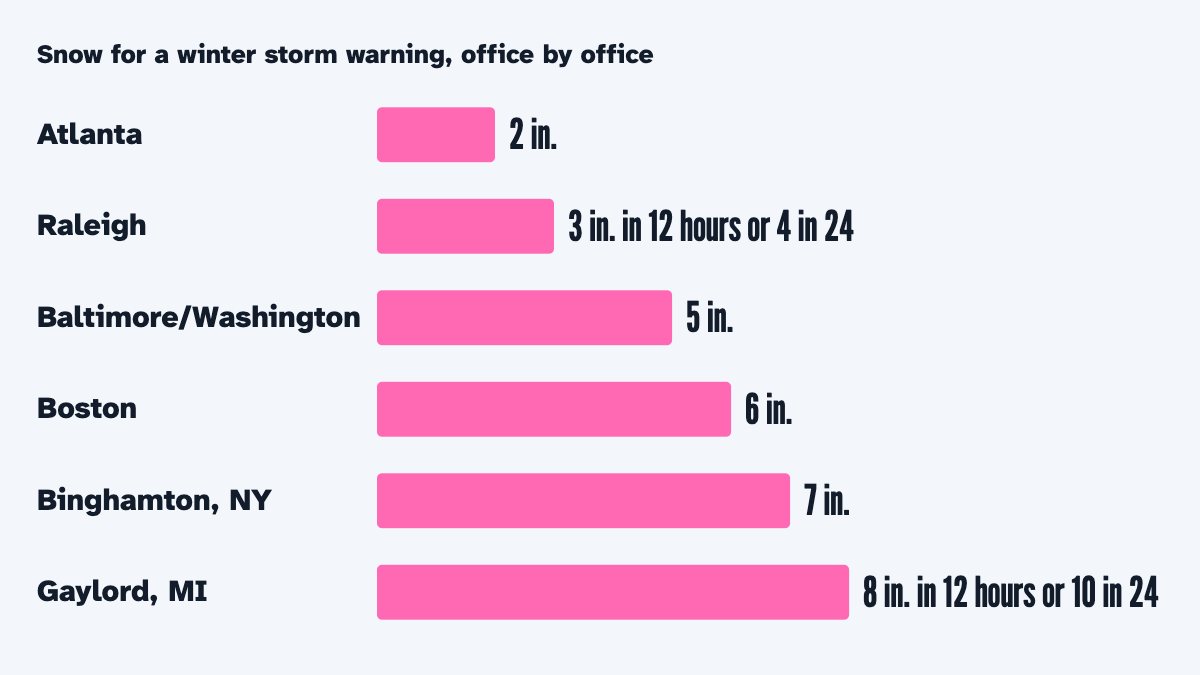
This is the heart of it. The same storm closes schools in one city and barely slows buses in another, and the Weather Service itself sets its warning levels office by office: a winter storm warning means about 2 inches of snow around Atlanta but 6 inches around Boston. In a study of Massachusetts schools, economist Joshua Goodman found that days with 10 inches or more closed schools, while 4 to 10 inch days mostly kept them open.
So the calculator starts from how much snow your area gets in a normal year, from NOAA’s U.S. Climate Normals for 1991–2020. It takes the weather stations with a snowfall normal nearest your ZIP code, up to four within 40 miles, and weights them by distance (stations within 8 miles count alike, and a station whose record NOAA marks as standard, 24 years or more, counts three times as much as one with a shorter record). Two more rules keep a mountaintop or a broken record from standing in for your town. A station more than about 500 feet higher or lower than your ZIP code’s point counts less, and one 2,500 feet off counts for almost nothing (the point’s height is from the U.S. Geological Survey’s 3D Elevation Program), so San Jose takes its snow from the valley, not from Mt. Hamilton, and Colorado Springs not from the mountain stations above it. And 18 of the 5,709 NOAA snowfall stations the calculator reads are left out: east of the Rockies, in gentle country, each reports under 30% of the snow of the stations around it at a similar height, most likely because snowfalls went unmeasured. From that normal snowfall it works out the usual closing point, the snowfall at which schools close about half the time:
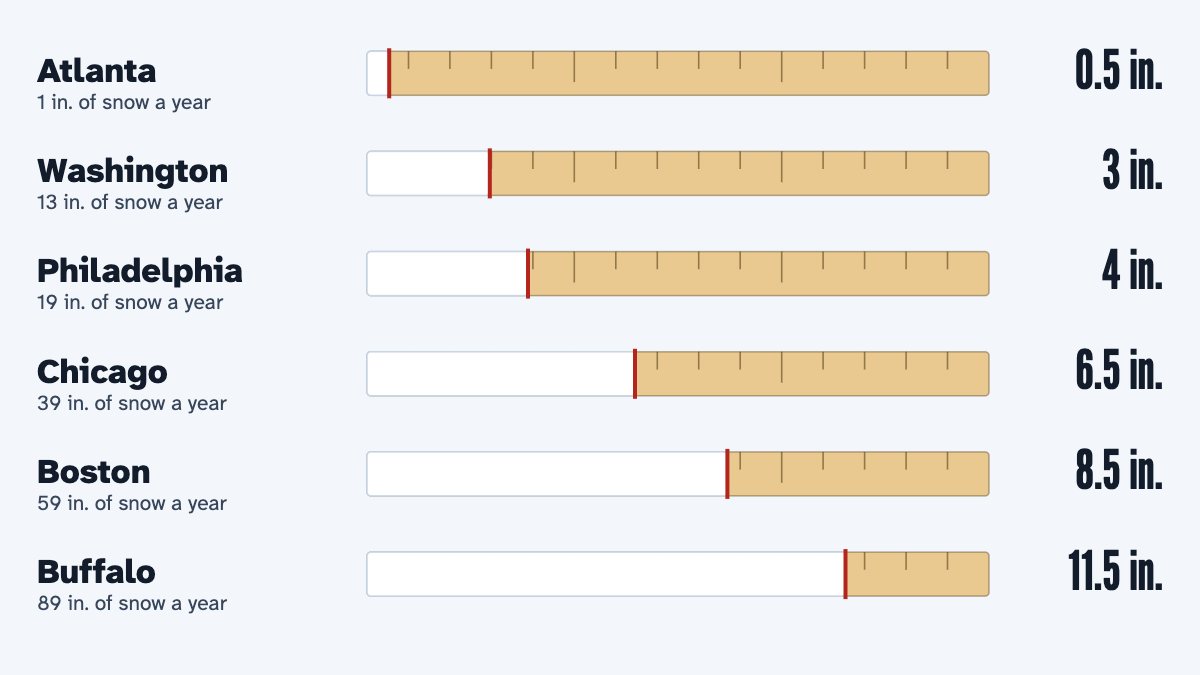
Closing point = 0.5 × (normal snowfall a year, in inches)0.7, never less than half an inch and never more than 15 inches (before your district setting, below).
For the cities on the snow day map that gives about half an inch in Atlanta, 3 inches in Washington, 4 in Philadelphia, 6½ in Chicago, 8 in Minneapolis, 8½ in Boston and 11½ in Buffalo. It is our rule of thumb, chosen to fit what districts and the research describe, not a number any district publishes.
What about ice and cold?
Freezing rain is the great equalizer: about a tenth of an inch makes roads dangerous almost anywhere. The calculator’s ice point is 0.08 inch plus 0.002 inch for each inch of snow your area gets in a normal year, counted up to 50 inches: 0.08 inch where no snow falls, 0.14 at 30 inches and 0.18 at 50 inches or more. It counts ice by when it falls, like snow. From about October 1, 2026 the Weather Service forecasts ice as radial ice, the thickness around a wire or branch, so this winter’s ice numbers may run differently from older ones; we will watch how they compare.
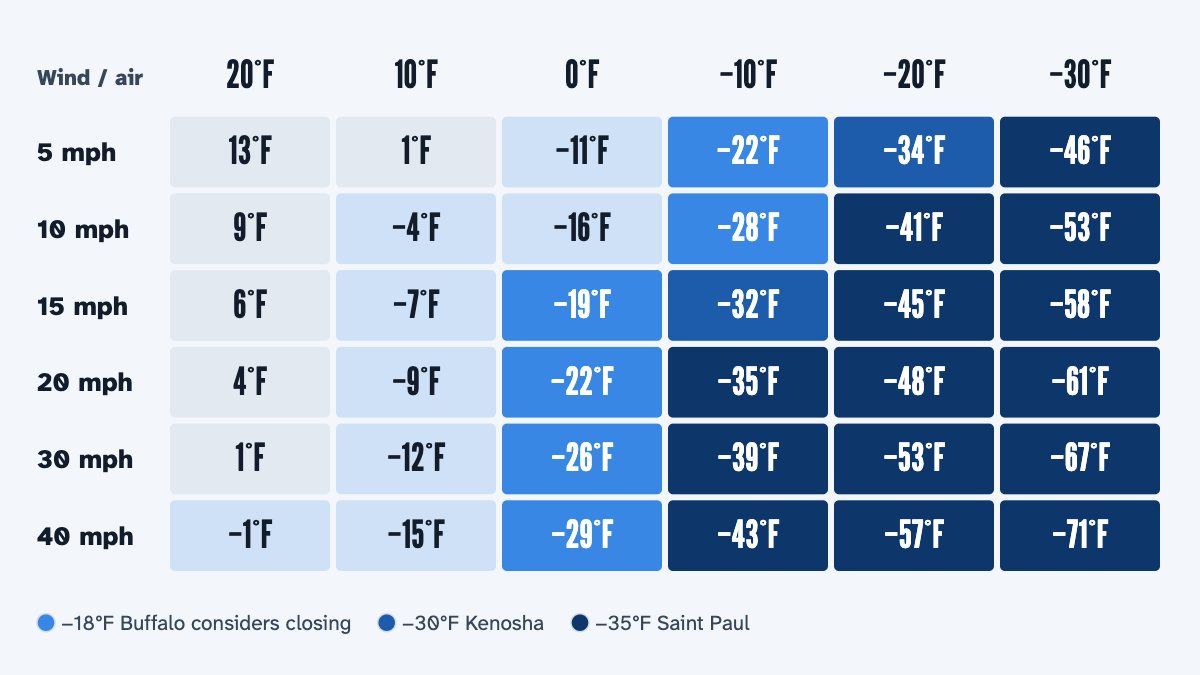
For cold, the calculator reads the lowest wind chill from 5 to 9 AM (the air temperature, for an hour the forecast gives no wind chill). Its cold point is your area’s normal December-to-February low minus 45°F, never colder than −60°F and never milder than 0°F. That puts it at −34°F in Minneapolis and Saint Paul, whose district may cancel school when the 6 AM forecast is −35°F or colder, at −54°F in Fairbanks, where very cold mornings are normal, and at −9°F in Atlanta.
How do Weather Service warnings count?
A warning is issued against the local office’s own limits, so it carries the forecasters’ judgment of what is serious there. The snow, ice or cold that sets a warning off is already counted, though, so a warning adds only a little more. The calculator raises the odds when an alert is in force at some time between 6 PM the evening before and 9 AM: most for a Blizzard Warning or an Ice Storm Warning, then an Extreme Cold Warning, then a Winter Storm Warning or a Lake Effect Snow Warning, then a Winter Storm Watch, an Extreme Cold Watch or a Snow Squall Warning (which counts only if it is in force from 5 to 9 AM), then a Winter Weather Advisory, and least a Cold Weather Advisory. Only the strongest alert counts. A Blizzard Warning or an Ice Storm Warning in force at any time from 5 to 9 AM keeps the snow-day chance at 65% or more, whatever your district setting. A Dense Fog or Freezing Fog Advisory at bus time adds a small chance of a late start, never of a closing.
How do the signs become three chances?
Each sign gives a chance that it alone closes school. For snow it is 1 ÷ (1 + (closing point ÷ snow)3): 50% at the closing point, 89% at twice it and 11% at half it (under 0.05 inch counts as none). For ice it is 1 ÷ (1 + (ice point ÷ ice)2.5) (under 0.01 inch counts as none). For cold it is 1 ÷ (1 + e(wind chill − cold point) ÷ 4): 50% at the cold point, 73% at 4°F colder and 27% at 4°F milder. The three are combined as the chance that at least one of them closes school. A warning then raises the odds by a set step, added to the log-odds (the logarithm of the chance of closing over the chance of not closing): 1.6 for a Blizzard or Ice Storm Warning, 0.8 for an Extreme Cold Warning, 0.6 for a Winter Storm or Lake Effect Snow Warning, 0.3 for a Winter Storm or Extreme Cold Watch and for a Snow Squall Warning, 0.2 for a Winter Weather Advisory and 0.15 for a Cold Weather Advisory. Then comes the 65% floor for blizzard and ice storm warnings, and the snow-day chance never goes above 99%.
A late start is worked out the same way at a lower bar, from the snow and ice that fall before 10 AM only: snow against 0.35 times the closing point where no snow falls in a normal year, rising evenly to 0.5 times it at 100 inches a year or more; ice against a quarter of the ice point; cold against 12°F milder than the cold point. A Dense Fog Advisory in force at bus time is a fourth sign with a 15% chance of its own (a Freezing Fog Advisory 25%), combined with the others in the same way. A warning raises these odds by 0.6 times its step. The chance of a late start is what that adds beyond the chance of closing, the two together never above 99%; what is left is school as usual.
Last, each chance is rounded to a whole percent, a half rounding up: the snow day first, then the late start, trimmed if the two would pass 100%, and school as usual is what is left, so the three always add up to 100%. A chance that rounds to 0 shows as “<1%”, and one that rounds to 100 as “>99%”.
Districts next door can decide differently with the same snow. If yours closes at the first flake, or almost never, tell the calculator: “closes easily” lowers the closing point and the ice point by 30% and makes the cold point 5°F milder; “rarely closes” raises them by 40% and makes the cold point 5°F colder. The setting applies after the limits above, so a closing point can be as low as 0.35 inch or as high as 21 inches, and a cold point from −65°F to 5°F.
Work it out by hand
- Find your area's normal snowfall a year: NOAA's 1991–2020 normal for the weather stations nearest you (each state's page lists them). Say it is 23 inches.
- Work out the usual closing point: 0.5 × 230.7 ≈ 4.5 inches (between half an inch and 15 inches whatever the area).
- Add up the forecast snow, counting each inch by when it falls: in full from 9 PM to 10 AM, 80% from noon to 9 PM the day before, 45% from 10 AM to 3 PM, 35% from 6 AM to noon the day before; less when it falls above freezing. Say 4 inches fall overnight: 4 inches count.
- Compare the two: the chance of a snow day from snow is 1 ÷ (1 + (closing point ÷ snow)3). Here 1 ÷ (1 + (4.5 ÷ 4)3) ≈ 41%.
- Do the same for ice (its point is 0.08 inch plus 0.002 inch for each inch of normal snowfall, counted up to 50 inches: here 0.08 + 0.002 × 23 ≈ 0.13 inch) and cold (your normal winter low minus 45°F, kept between −60°F and 0°F), and combine the three as chances that something closes school.
- If the Weather Service has a Winter Storm Warning in force overnight, the odds go up (for this example from 41% to about 56%, with a late start at about 38% and school as usual at about 6%); a watch or an advisory adds less. A Blizzard Warning or an Ice Storm Warning in force at any time from 5 to 9 AM keeps the chance of a snow day at 65% or more.
- What is left is split between a late start (the same signs at about a third to a half of the closing point, counting only the snow and ice that fall before 10 AM) and school as usual.
What can’t it know?
- What your district decides. Only the district knows its roads, buses, buildings and staff on the morning; this site cannot see its decisions.
- Snow that fell before the forecast it holds. The Weather Service’s data keeps only the last few hours, and the calculator keeps 36 hours more only for places someone asked about; elsewhere, snow that fell earlier is not counted, and the answer says so. It cannot see how deep the snow on the ground is, either. After a big snowfall the real chance can be higher than it shows.
- How good the forecast is. Snow forecasts miss: the Weather Service office for Baltimore and Washington says about one in three of its winter storm warnings does not reach warning size.
- How often it is right. We have not yet measured the calculator against real closings, and we found no independent test of any snow day calculator, so we do not claim a success rate.
How we test it
The rules are written twice, for our server and for your browser, and both must give the same numbers, to nine decimal places, on 20,000 made-up forecasts before any change goes live. Both are also checked against cases worked out by hand from the formulas on this page. Every half hour the site runs the rules for 296 cities, and their numbers are on the snow day map for anyone to see.
Questions people ask
Why does the calculator say 41% when it is snowing hard?
Because it looks at the next school day and at the snow that counts for it. Snow that ends in the evening has the night to be cleared and counts for less, and in a snowy place a few inches are below the usual closing point. If some of the snow fell before the forecast hours the calculator holds, the answer says so, and the real chance is higher.
Is the snow day calculator accurate?
It is as good as the forecast and the rule of thumb, and both can miss. That is why it shows its reasons and gives chances, not promises. A 70% chance means that in about three of ten such mornings, school stays open.
Does the calculator use my location?
No. It uses only the ZIP code you type, and the part of that ZIP code where most people live. It never asks for your location, and nothing you type is stored with anything that identifies you.
Sources: National Weather Service API; Palecki et al. (2021), U.S. Climate Normals 1991–2020, NOAA National Centers for Environmental Information; U.S. Census Bureau Gazetteer files.
Facts checked October 29, 2026.
More guides
-
-
-
-
-
-