How Much Snow Does It Take to Close School? Inches by City
It depends on where you live. By our rule of thumb, schools close about half the time at half an inch of snow in Atlanta and 11.5 inches in Buffalo. Timing and ice count too.

There is no national number: how much snow closes school depends on where you live. Where snow is rare, a little goes a long way; where it is common, it takes far more. By our rule of thumb, schools close about half the time with around half an inch of overnight snow in Atlanta, 3 inches in Washington, 6.5 inches in Chicago, 8 inches in Minneapolis and 11.5 inches in Buffalo.
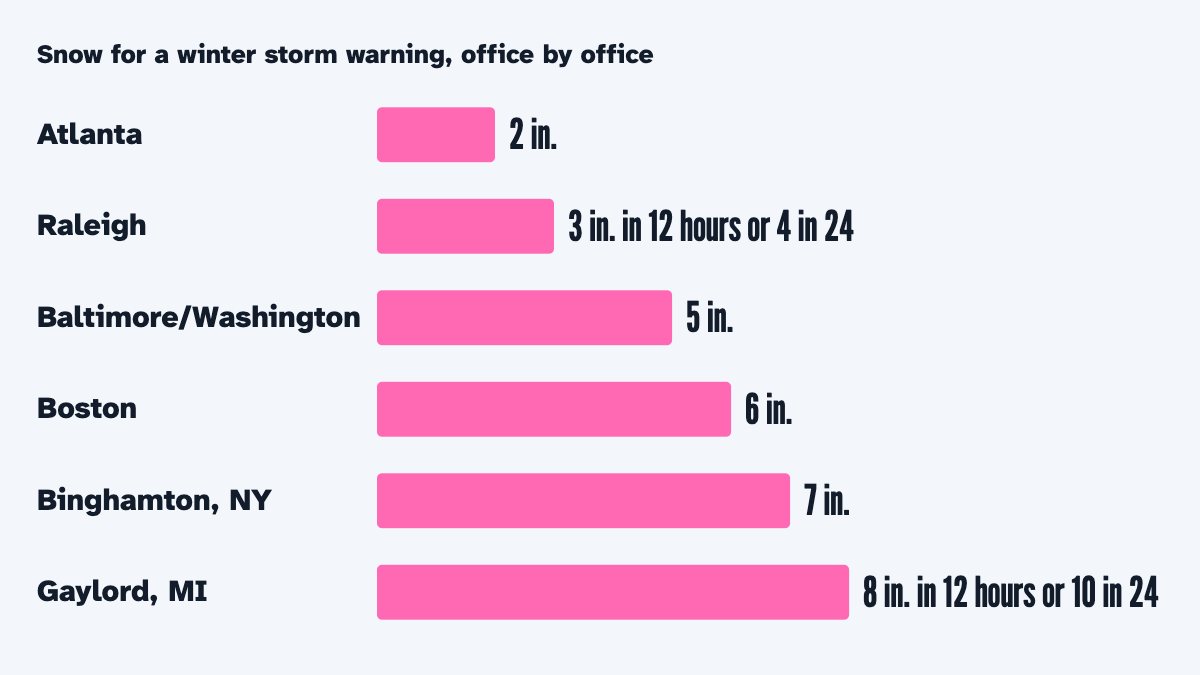
The National Weather Service draws its own lines the same way. Its office for the Atlanta area issues a Winter Storm Warning for 2 inches of snow, while its office in Gaylord, Michigan, waits for 8 inches in 12 hours or 10 in 24. And in Massachusetts, a study by Joshua Goodman found that days with 10 inches or more closed schools, while days with 4 to 10 inches mostly did not, though they kept more students home.
Inches are only part of it. Snow that falls overnight matters more than snow after lunch, ice counts at tiny amounts, and cold can close schools with no snow at all.
Why does it take more snow to close schools in the North?
Because what counts as a lot of snow is local, and even the National Weather Service sets its warnings by local standards. Each of its offices issues warnings, watches and advisories “based on local criteria,” its winter alerts page explains, and the snow needed for a Winter Storm Warning in the Northern Plains is typically much higher than in the Southeast. Here is the snow that triggers a Winter Storm Warning at six offices, from least to most:
- Atlanta area: 2 inches of snow, or a quarter inch of freezing rain.
- Raleigh, North Carolina: 3 inches in 12 hours or 4 inches in 24 hours, averaged over a county.
- Baltimore and Washington: 5 inches, or 6 in six western counties.
- Boston: 6 inches averaged over a forecast zone, or 7 in the Berkshires.
- Binghamton, New York: 7 inches in a storm in New York, or 6 in northeast Pennsylvania.
- Gaylord, northern Michigan: 8 inches in 12 hours or 10 inches in 24.
The same three words, Winter Storm Warning, mean about 2 inches in north Georgia and 8 to 10 inches in northern Michigan. Districts describe the same gap from the ground. Fairfax County, Virginia, explains that because the Washington area seldom gets heavy snow, its roads take longer to clear.
School news
Our rule of thumb follows the same pattern. These yardsticks show the snowfall at which, by our rule, schools close about half the time in ten well-known cities:
What did the Massachusetts snow day study find?
That big storms close schools and middling ones mostly keep students home. Joshua Goodman’s 2014 working paper for the National Bureau of Economic Research used statewide student data from Massachusetts, plus closing records he gathered by emailing about 350 districts for the years 2003 to 2010.
He split school days into moderately snowy ones, with 4 to 10 inches, and extremely snowy ones, with 10 inches or more. Extreme days were strongly tied to closings. Moderate days were not, once the extreme ones were counted, but they were strongly tied to absences. In his summary, “moderate snowfall induces student absences while extreme snowfall induces school closures.”
Those days are rarer than they feel. The average Massachusetts student had 2.3 school days a year with 4 inches or more, and 0.3 days with 10 inches or more. The paper gives no single closing number: a footnote puts the gap down to measurement error, chiefly that some of those storms may have fallen in vacation weeks, and says most schools would also shut for 9 inches.
Superintendents have reasons to hold out, the paper notes. Parents must find child care, and the state requires 180 school days, so closings are made up later in the year; waivers are rare.
Goodman’s most surprising finding cuts the other way: each absence caused by bad weather lowered math scores by about 0.05 standard deviations, while closings showed no effect, which he puts down to teachers coping well when everyone misses the same day. Not everyone agrees. In a 2008 Maryland study, Marcotte and Hemelt found nearly 3 percent fewer third graders doing satisfactorily in years with five unscheduled closings, the average, than in years with none.
Our rule of thumb lands in the same range. By our rule, schools close about half the time at 8.5 inches in Boston and 9 inches in Worcester: near the top of his 4-to-10-inch band, just below the 10 inches where closings became common.
Where did the 2014 map of how much snow cancels school come from?
From Reddit, not from school districts. What we know about it comes from news reports at the time, so read it as a news story, not a study. A Reddit user posted it in late January 2014, and NPR wrote about it on January 31 (news reporting, NPR).
By his own description, he built it from hundreds of answers people sent him, “interpolated using NOAA’s average annual snowfall days map.” So it is an informal survey smoothed with a climate map, not a record of what districts did.
He was frank about its limits, a news service reported at the time (Great Lakes Echo). Its snow means what piles up overnight or within 24 hours, and its “any snow” color includes places where a forecast of snow alone is enough. In the Midwest and Great Plains, he said, wind chill and temperature often matter more than snow, so the map may mislead there. Big cities such as Chicago and New York often need more snow to close, he added, because they have more resources to clear it.
NPR summed it up as the South closing for any snow and the far North needing a foot or more, while noting that schools close for more than snow: cold in Chicago, ice in the South. We found no study that checked the map against real closings. Our rule of thumb uses the same idea, that snowier places need more snow to close, but builds it from each place’s measured snowfall instead of a survey.
Does it matter when the snow falls?
Yes, a great deal. Snow that piles up overnight is on the roads when the buses start, while snow due in the afternoon tends to bring an early dismissal instead. Montgomery County, Maryland, decides on early release by 10:30 AM when weather threatens the afternoon trip home, and Columbus, Ohio, can dismiss as early as noon.
Districts weigh timing in their own words. Minneapolis asks whether a storm hits overnight or during school. Gwinnett County, Georgia, says overnight road conditions make it more likely to cancel early in the morning than to let students out early.
The Weather Service draws the same line. Its Baltimore/Washington office issues a Winter Weather Advisory for just 1 inch in the metro areas when it falls in rush hours, 4 to 9 AM or 2 to 7 PM, instead of the usual 2 to 4 inches.
Our calculator counts snow by when it falls, from 6 AM the day before to 3 PM on the school day. Snow overnight (9 PM to 6 AM) and while buses run (6 to 10 AM) counts in full. Snow in the afternoon and evening before counts 80%, during the school day 45%, and the morning before 35%.
Snow falling above freezing counts less, because roads stay wet, and gusts of 25 mph or more during snowy hours between 9 PM and 10 AM, when an inch or more counts in all, make it count more. How the calculator works has the details.
Does ice close schools more easily than snow?
Yes. By our rule of thumb, about a tenth of an inch of ice closes schools almost anywhere: 0.08 inch in places with little snow, up to 0.18 inch in snowy ones.
The Weather Service treats small amounts of ice as serious too. Its Ice Storm Warning is usually issued for about a quarter inch of ice. Its Atlanta-area office counts a quarter inch of freezing rain, or half an inch of sleet, as warning-level, the same as 2 inches of snow, and its Boston office issues an advisory for any freezing rain on the roads.
Southern districts name ice on their own pages. Fulton County, Georgia, tracks when snow or ice starts and how much falls, and Nashville warns that icy conditions can affect bus service in parts of its large county.
How does our rule of thumb work out the closing point?
It starts from how much snow a place normally gets in a year. The usual closing point, the snowfall at which schools close about half the time, is 0.5 × (normal snowfall a year, in inches)0.7, kept between half an inch and 15 inches. The normal snowfall comes from NOAA’s 1991–2020 climate normals.
The power of 0.7 means the closing point grows more slowly than the snowfall: a place with ten times the snow needs about five times as much to close.
Then the forecast takes over. The calculator weighs when the snow falls, any ice, the wind chill from 5 to 9 AM, and National Weather Service alerts: warnings add to the chance, watches and advisories less. If you know your district rarely closes, or closes easily, you can say so, and the closing point moves. The result is three chances that add up to 100%: a snow day, a late start or school as usual.
Try it here. Pick your city and move the overnight snow. The tool uses a plain storm, with snow between 9 PM and 6 AM and no warning out, so a real forecast can come out higher or lower.
How much snow would close school here?
Philadelphia, PA (about 19 in. of snow a year), with 4 in. overnight: snow day 52%, late start 43%, school as usual 5%. By our rule of thumb, schools there usually close at about 4 in.
Worked out with the calculator's own rules for a plain storm: the snow falls between 9 PM and 6 AM, it is 25°F with little wind, and no Weather Service warning is out. A real forecast also counts timing, ice, cold and alerts.
Try the same 2 inches in Raleigh and in Buffalo, then find the amount at which your own city reaches a coin flip. These are the calculator’s estimates, not any district’s rule; only your district decides.
Every city on our snow day map, with its normal snowfall and its usual closing point by our rule of thumb, is in the table below, with a CSV file to download.
The normal snowfall a year (NOAA 1991–2020 climate normals) and the snowfall at which schools usually close, by the calculator's rule of thumb, for 296 U.S. cities: the six largest in each state (Honolulu only in Hawaii) and Washington, D.C.
Show all 296 cities
| City | Normal snowfall | Usually closes at |
|---|---|---|
| Alabama | ||
| Huntsville | 1.8 in. | 1 in. |
| Mobile | 0.2 in. | 0.5 in. |
| Birmingham | 1.2 in. | 0.5 in. |
| Montgomery | 0.2 in. | 0.5 in. |
| Tuscaloosa | 0.1 in. | 0.5 in. |
| Hoover | 1.2 in. | 0.5 in. |
| Alaska | ||
| Anchorage | 76.9 in. | 10.5 in. |
| Fairbanks | 58.6 in. | 8.5 in. |
| Juneau | 84.4 in. | 11 in. |
| Wasilla | 66.3 in. | 9.5 in. |
| Sitka | 101.8 in. | 12.5 in. |
| Ketchikan | 34.8 in. | 6 in. |
| Arizona | ||
| Phoenix | 0 in. | 0.5 in. |
| Tucson | 0.1 in. | 0.5 in. |
| Mesa | 0 in. | 0.5 in. |
| Gilbert | 0 in. | 0.5 in. |
| Chandler | 0 in. | 0.5 in. |
| Glendale | 0.1 in. | 0.5 in. |
| Arkansas | ||
| Little Rock | 3.5 in. | 1 in. |
| Fayetteville | 6.6 in. | 2 in. |
| Fort Smith | 2.8 in. | 1 in. |
| Springdale | 7.7 in. | 2 in. |
| Jonesboro | 3.6 in. | 1 in. |
| Rogers | 9 in. | 2.5 in. |
| California | ||
| Los Angeles | 0 in. | 0.5 in. |
| San Diego | 0 in. | 0.5 in. |
| San Jose | 0 in. | 0.5 in. |
| San Francisco | 0 in. | 0.5 in. |
| Fresno | 0 in. | 0.5 in. |
| Sacramento | 0 in. | 0.5 in. |
| Colorado | ||
| Denver | 46.8 in. | 7.5 in. |
| Colorado Springs | 43.9 in. | 7 in. |
| Aurora | 48.7 in. | 7.5 in. |
| Fort Collins | 50.8 in. | 8 in. |
| Lakewood | 59.9 in. | 9 in. |
| Thornton | 55.3 in. | 8.5 in. |
| Connecticut | ||
| Bridgeport | 34.8 in. | 6 in. |
| Stamford | 34.3 in. | 6 in. |
| New Haven | 36.6 in. | 6 in. |
| Hartford | 51.3 in. | 8 in. |
| Waterbury | 50 in. | 7.5 in. |
| Norwalk | 35.4 in. | 6 in. |
| Delaware | ||
| Wilmington | 19.4 in. | 4 in. |
| Dover | 13.3 in. | 3 in. |
| Newark | 19.5 in. | 4 in. |
| Middletown | 18.1 in. | 4 in. |
| Milford | 12.9 in. | 3 in. |
| Smyrna | 15 in. | 3.5 in. |
| Washington, D.C. | ||
| Washington | 12.7 in. | 3 in. |
| Florida | ||
| Jacksonville | 0 in. | 0.5 in. |
| Miami | 0 in. | 0.5 in. |
| Tampa | 0 in. | 0.5 in. |
| Orlando | 0 in. | 0.5 in. |
| St. Petersburg | 0 in. | 0.5 in. |
| Port St. Lucie | 0 in. | 0.5 in. |
| Georgia | ||
| Atlanta | 1.1 in. | 0.5 in. |
| Columbus | 0.4 in. | 0.5 in. |
| Augusta | 0.8 in. | 0.5 in. |
| Macon | 0.2 in. | 0.5 in. |
| Savannah | 0 in. | 0.5 in. |
| Athens | 0.7 in. | 0.5 in. |
| Hawaii | ||
| Honolulu | 0 in. | 0.5 in. |
| Idaho | ||
| Boise | 21.7 in. | 4.5 in. |
| Meridian | 18.4 in. | 4 in. |
| Nampa | 13.1 in. | 3 in. |
| Caldwell | 10.5 in. | 2.5 in. |
| Idaho Falls | 43.8 in. | 7 in. |
| Pocatello | 40.5 in. | 6.5 in. |
| Illinois | ||
| Chicago | 38.7 in. | 6.5 in. |
| Aurora | 31 in. | 5.5 in. |
| Naperville | 28.1 in. | 5 in. |
| Joliet | 25.4 in. | 5 in. |
| Rockford | 36.4 in. | 6 in. |
| Elgin | 37.7 in. | 6.5 in. |
| Indiana | ||
| Indianapolis | 24.5 in. | 4.5 in. |
| Fort Wayne | 33.2 in. | 6 in. |
| Evansville | 10.8 in. | 2.5 in. |
| Fishers | 21.4 in. | 4.5 in. |
| South Bend | 58.9 in. | 8.5 in. |
| Carmel | 21.8 in. | 4.5 in. |
| Iowa | ||
| Des Moines | 34.2 in. | 6 in. |
| Cedar Rapids | 32.7 in. | 5.5 in. |
| Davenport | 35.1 in. | 6 in. |
| Sioux City | 35.6 in. | 6 in. |
| Ankeny | 32.7 in. | 5.5 in. |
| Iowa City | 27.8 in. | 5 in. |
| Kansas | ||
| Wichita | 11.9 in. | 3 in. |
| Overland Park | 14.2 in. | 3 in. |
| Kansas City | 15.8 in. | 3.5 in. |
| Olathe | 14.6 in. | 3.5 in. |
| Topeka | 15.9 in. | 3.5 in. |
| Lawrence | 12.1 in. | 3 in. |
| Kentucky | ||
| Louisville | 12.3 in. | 3 in. |
| Lexington | 13.6 in. | 3 in. |
| Bowling Green | 8.2 in. | 2 in. |
| Owensboro | 6.7 in. | 2 in. |
| Covington | 20.1 in. | 4 in. |
| Georgetown | 13.9 in. | 3 in. |
| Louisiana | ||
| New Orleans | 0 in. | 0.5 in. |
| Baton Rouge | 0.1 in. | 0.5 in. |
| Shreveport | 0.8 in. | 0.5 in. |
| Lafayette | 0 in. | 0.5 in. |
| Lake Charles | 0 in. | 0.5 in. |
| Kenner | 0 in. | 0.5 in. |
| Maine | ||
| Portland | 72.9 in. | 10 in. |
| Lewiston | 75.2 in. | 10.5 in. |
| Bangor | 74.5 in. | 10 in. |
| South Portland | 70.1 in. | 10 in. |
| Auburn | 75.2 in. | 10.5 in. |
| Sanford | 64.2 in. | 9 in. |
| Maryland | ||
| Baltimore | 20.9 in. | 4 in. |
| Frederick | 31 in. | 5.5 in. |
| Gaithersburg | 25 in. | 5 in. |
| Rockville | 17.6 in. | 3.5 in. |
| Bowie | 15.9 in. | 3.5 in. |
| Hagerstown | 31.4 in. | 5.5 in. |
| Massachusetts | ||
| Boston | 59.1 in. | 8.5 in. |
| Worcester | 60.8 in. | 9 in. |
| Springfield | 46.6 in. | 7.5 in. |
| Cambridge | 59 in. | 8.5 in. |
| Lowell | 63.2 in. | 9 in. |
| Brockton | 56 in. | 8.5 in. |
| Michigan | ||
| Detroit | 35 in. | 6 in. |
| Grand Rapids | 75 in. | 10.5 in. |
| Warren | 30.6 in. | 5.5 in. |
| Sterling Heights | 32.8 in. | 6 in. |
| Ann Arbor | 57.7 in. | 8.5 in. |
| Lansing | 42.2 in. | 7 in. |
| Minnesota | ||
| Minneapolis | 51.1 in. | 8 in. |
| St. Paul | 49.4 in. | 7.5 in. |
| Rochester | 50.7 in. | 8 in. |
| Bloomington | 51.4 in. | 8 in. |
| Duluth | 80.8 in. | 11 in. |
| Brooklyn Park | 51.9 in. | 8 in. |
| Mississippi | ||
| Jackson | 1 in. | 0.5 in. |
| Gulfport | 0.2 in. | 0.5 in. |
| Southaven | 1.9 in. | 1 in. |
| Hattiesburg | 0.7 in. | 0.5 in. |
| Biloxi | 0.2 in. | 0.5 in. |
| Olive Branch | 1.8 in. | 1 in. |
| Missouri | ||
| Kansas City | 13 in. | 3 in. |
| St. Louis | 14.3 in. | 3 in. |
| Springfield | 12.5 in. | 3 in. |
| Columbia | 16.8 in. | 3.5 in. |
| Independence | 11.5 in. | 3 in. |
| Lee's Summit | 12.2 in. | 3 in. |
| Montana | ||
| Billings | 50.5 in. | 8 in. |
| Missoula | 44.6 in. | 7 in. |
| Great Falls | 65.1 in. | 9.5 in. |
| Bozeman | 80.2 in. | 11 in. |
| Butte | 37.7 in. | 6.5 in. |
| Helena | 37 in. | 6.5 in. |
| Nebraska | ||
| Omaha | 30 in. | 5.5 in. |
| Lincoln | 27.2 in. | 5 in. |
| Bellevue | 27.5 in. | 5 in. |
| Grand Island | 27.2 in. | 5 in. |
| Kearney | 22.8 in. | 4.5 in. |
| Fremont | 29.8 in. | 5.5 in. |
| Nevada | ||
| Las Vegas | 0.2 in. | 0.5 in. |
| Henderson | 0.2 in. | 0.5 in. |
| North Las Vegas | 0.2 in. | 0.5 in. |
| Reno | 25 in. | 5 in. |
| Sparks | 25 in. | 5 in. |
| Carson City | 25.4 in. | 5 in. |
| New Hampshire | ||
| Manchester | 57.5 in. | 8.5 in. |
| Nashua | 62 in. | 9 in. |
| Concord | 66.6 in. | 9.5 in. |
| Dover | 56.1 in. | 8.5 in. |
| Rochester | 50.6 in. | 8 in. |
| Keene | 65.2 in. | 9.5 in. |
| New Jersey | ||
| Newark | 29 in. | 5.5 in. |
| Jersey City | 29.8 in. | 5.5 in. |
| Paterson | 29.4 in. | 5.5 in. |
| Elizabeth | 29.1 in. | 5.5 in. |
| Trenton | 25 in. | 5 in. |
| Clifton | 29.4 in. | 5.5 in. |
| New Mexico | ||
| Albuquerque | 12.6 in. | 3 in. |
| Las Cruces | 1 in. | 0.5 in. |
| Rio Rancho | 8.4 in. | 2 in. |
| Santa Fe | 23.5 in. | 4.5 in. |
| Roswell | 8.1 in. | 2 in. |
| Farmington | 8.6 in. | 2.5 in. |
| New York | ||
| New York | 28.5 in. | 5 in. |
| Buffalo | 88.6 in. | 11.5 in. |
| Yonkers | 30 in. | 5.5 in. |
| Rochester | 92.3 in. | 12 in. |
| Syracuse | 120.5 in. | 14.5 in. |
| Albany | 57 in. | 8.5 in. |
| North Carolina | ||
| Charlotte | 3.2 in. | 1 in. |
| Raleigh | 4.9 in. | 1.5 in. |
| Greensboro | 6.3 in. | 2 in. |
| Durham | 4.5 in. | 1.5 in. |
| Winston-Salem | 6.5 in. | 2 in. |
| Fayetteville | 1.3 in. | 0.5 in. |
| North Dakota | ||
| Fargo | 50.5 in. | 8 in. |
| Bismarck | 50 in. | 7.5 in. |
| Grand Forks | 48.4 in. | 7.5 in. |
| Minot | 48.4 in. | 7.5 in. |
| West Fargo | 50.3 in. | 8 in. |
| Williston | 44 in. | 7 in. |
| Ohio | ||
| Columbus | 24 in. | 4.5 in. |
| Cleveland | 64.7 in. | 9.5 in. |
| Cincinnati | 18.5 in. | 4 in. |
| Toledo | 35 in. | 6 in. |
| Akron | 46.1 in. | 7.5 in. |
| Dayton | 19.8 in. | 4 in. |
| Oklahoma | ||
| Oklahoma City | 6.2 in. | 2 in. |
| Tulsa | 8.4 in. | 2 in. |
| Norman | 5.2 in. | 1.5 in. |
| Broken Arrow | 7.5 in. | 2 in. |
| Edmond | 4.8 in. | 1.5 in. |
| Lawton | 1.7 in. | 0.5 in. |
| Oregon | ||
| Portland | 3.6 in. | 1 in. |
| Salem | 5.3 in. | 1.5 in. |
| Eugene | 2.2 in. | 1 in. |
| Gresham | 4.1 in. | 1.5 in. |
| Hillsboro | 4 in. | 1.5 in. |
| Bend | 20.9 in. | 4 in. |
| Pennsylvania | ||
| Philadelphia | 18.7 in. | 4 in. |
| Pittsburgh | 34.7 in. | 6 in. |
| Allentown | 33.5 in. | 6 in. |
| Reading | 26.5 in. | 5 in. |
| Erie | 108.4 in. | 13.5 in. |
| Bethlehem | 34.2 in. | 6 in. |
| Rhode Island | ||
| Providence | 44.4 in. | 7 in. |
| Cranston | 45.2 in. | 7 in. |
| Warwick | 35 in. | 6 in. |
| Pawtucket | 43.4 in. | 7 in. |
| East Providence | 41.4 in. | 7 in. |
| Woonsocket | 44.7 in. | 7 in. |
| South Carolina | ||
| Charleston | 0.3 in. | 0.5 in. |
| Columbia | 0.9 in. | 0.5 in. |
| North Charleston | 0.3 in. | 0.5 in. |
| Mount Pleasant | 0.3 in. | 0.5 in. |
| Rock Hill | 1.7 in. | 0.5 in. |
| Greenville | 3.1 in. | 1 in. |
| South Dakota | ||
| Sioux Falls | 45.5 in. | 7 in. |
| Rapid City | 48.4 in. | 7.5 in. |
| Aberdeen | 42.1 in. | 7 in. |
| Brookings | 36.1 in. | 6 in. |
| Watertown | 37.4 in. | 6.5 in. |
| Yankton | 38.3 in. | 6.5 in. |
| Tennessee | ||
| Nashville | 3.6 in. | 1 in. |
| Memphis | 2.5 in. | 1 in. |
| Knoxville | 4.4 in. | 1.5 in. |
| Chattanooga | 1.6 in. | 0.5 in. |
| Clarksville | 1.3 in. | 0.5 in. |
| Murfreesboro | 2.3 in. | 1 in. |
| Texas | ||
| Houston | 0 in. | 0.5 in. |
| San Antonio | 0.2 in. | 0.5 in. |
| Dallas | 1.4 in. | 0.5 in. |
| Fort Worth | 1.5 in. | 0.5 in. |
| Austin | 0.2 in. | 0.5 in. |
| El Paso | 2.4 in. | 1 in. |
| Utah | ||
| Salt Lake City | 60.1 in. | 9 in. |
| West Valley City | 48.9 in. | 7.5 in. |
| West Jordan | 57.9 in. | 8.5 in. |
| Provo | 51.9 in. | 8 in. |
| St. George | 1.7 in. | 0.5 in. |
| Orem | 45 in. | 7 in. |
| Vermont | ||
| Burlington | 76.2 in. | 10.5 in. |
| South Burlington | 79.6 in. | 10.5 in. |
| Rutland | 79.2 in. | 10.5 in. |
| Essex Junction | 79.5 in. | 10.5 in. |
| Winooski | 76.3 in. | 10.5 in. |
| Barre | 95.1 in. | 12 in. |
| Virginia | ||
| Virginia Beach | 5.2 in. | 1.5 in. |
| Chesapeake | 5.3 in. | 1.5 in. |
| Richmond | 9.9 in. | 2.5 in. |
| Norfolk | 5.1 in. | 1.5 in. |
| Newport News | 3.7 in. | 1 in. |
| Alexandria | 11.8 in. | 3 in. |
| Washington | ||
| Seattle | 4.2 in. | 1.5 in. |
| Spokane | 45.3 in. | 7 in. |
| Tacoma | 4.2 in. | 1.5 in. |
| Vancouver | 3.1 in. | 1 in. |
| Bellevue | 4.2 in. | 1.5 in. |
| Kent | 7.4 in. | 2 in. |
| West Virginia | ||
| Charleston | 26.1 in. | 5 in. |
| Huntington | 11.7 in. | 3 in. |
| Morgantown | 19.1 in. | 4 in. |
| Parkersburg | 14.1 in. | 3 in. |
| Wheeling | 16.1 in. | 3.5 in. |
| Martinsburg | 27.3 in. | 5 in. |
| Wisconsin | ||
| Milwaukee | 47 in. | 7.5 in. |
| Madison | 47.3 in. | 7.5 in. |
| Green Bay | 56.4 in. | 8.5 in. |
| Kenosha | 39.3 in. | 6.5 in. |
| Racine | 42.1 in. | 7 in. |
| Appleton | 48.8 in. | 7.5 in. |
| Wyoming | ||
| Cheyenne | 61 in. | 9 in. |
| Casper | 74.1 in. | 10 in. |
| Gillette | 54.8 in. | 8 in. |
| Laramie | 68 in. | 9.5 in. |
| Rock Springs | 39.3 in. | 6.5 in. |
| Sheridan | 64.4 in. | 9 in. |
Download “How much snow closes school in 296 U.S. cities” (CSV, opens in Excel)
Built from: U.S. Climate Normals, 1991–2020 (National Centers for Environmental Information); City and Town Population Totals: 2020–2024 (United States Census Bureau).
The whole answer, on one map:
How much snow closes school
- Where you live
- Rare snow, low bar
- Snowy places, high bar
- Weather Service lines differ
- When it falls
- Overnight counts most
- Rush hour matters
- Afternoon snow, early dismissal
- Ice
- About a tenth of an inch
- Ice storm warning near 1/4 inch
- The research
- 10+ inches closed schools
- 4 to 10 inches kept students home
- Our rule of thumb
- Built from normal snowfall
- Half an inch to 15 inches
- Only districts decide
Questions people ask
Is 2 inches of snow enough for a snow day?
It depends on where you live. By our rule of thumb, 2 inches overnight is past the usual closing point in Atlanta, Dallas, Raleigh and Seattle, and well short of it in Chicago, Boston and Buffalo. In the Weather Service’s terms, 2 inches is warning-level around Atlanta and advisory-level around Washington.
How many inches of snow for a snow day in Michigan?
By our rule of thumb, about 6 inches in Detroit, 7 in Lansing, 8.5 in Ann Arbor and 10.5 in Grand Rapids, which gets about twice Detroit’s snow. In northern Michigan, the Weather Service’s Gaylord office waits for 8 inches in 12 hours, or 10 in 24, before it issues a Winter Storm Warning. Our Michigan page has the rest of the state.
Does a Winter Storm Warning mean school is canceled?
No. A warning means the local Weather Service office expects snow or ice above its own local line. It adds to the chance in our calculator, but each district decides for itself, and warnings can miss: the Baltimore/Washington office says about 1 in 3 of its warnings are false alarms, many of them storms with real snow just under the warning level.
Why do Southern schools close for so little snow?
Because a little snow there is a lot. The Weather Service’s Atlanta-area office calls 2 inches warning-level, and Fairfax County, near Washington, says roads take longer to clear where heavy snow is rare. Ice closes schools at very small amounts too: by our rule of thumb, about a tenth of an inch.
How much snow does it take to close schools in New York City?
By our rule of thumb, about 5 inches. The city also has another option: on January 26, 2026, it closed its school buildings and kept classes going remotely, partly to meet the state’s 180-day requirement.
Sources: National Weather Service, Winter Weather Warnings, Watches and Advisories; Goodman, “Flaking Out: Student Absences and Snow Days as Disruptions of Instructional Time,” NBER Working Paper 20221; NOAA, U.S. Climate Normals 1991–2020.
Facts checked October 29, 2026.
More guides
-
-
-

-
-